TNX and SPX Relationship
The S&P 500 is driven by large-cap growth stocks – like Apple Inc, Amazon and Microsoft.
When traders start reevaluating how much they are willing to pay for these stocks based on their future earnings potential, the S&P 500 suffers.
You can see a direct inverse correlation between the value of the TNX and the value of the S&P 500 (SPX) this year (see below figures).
When the TNX moves higher, the SPX moves lower.
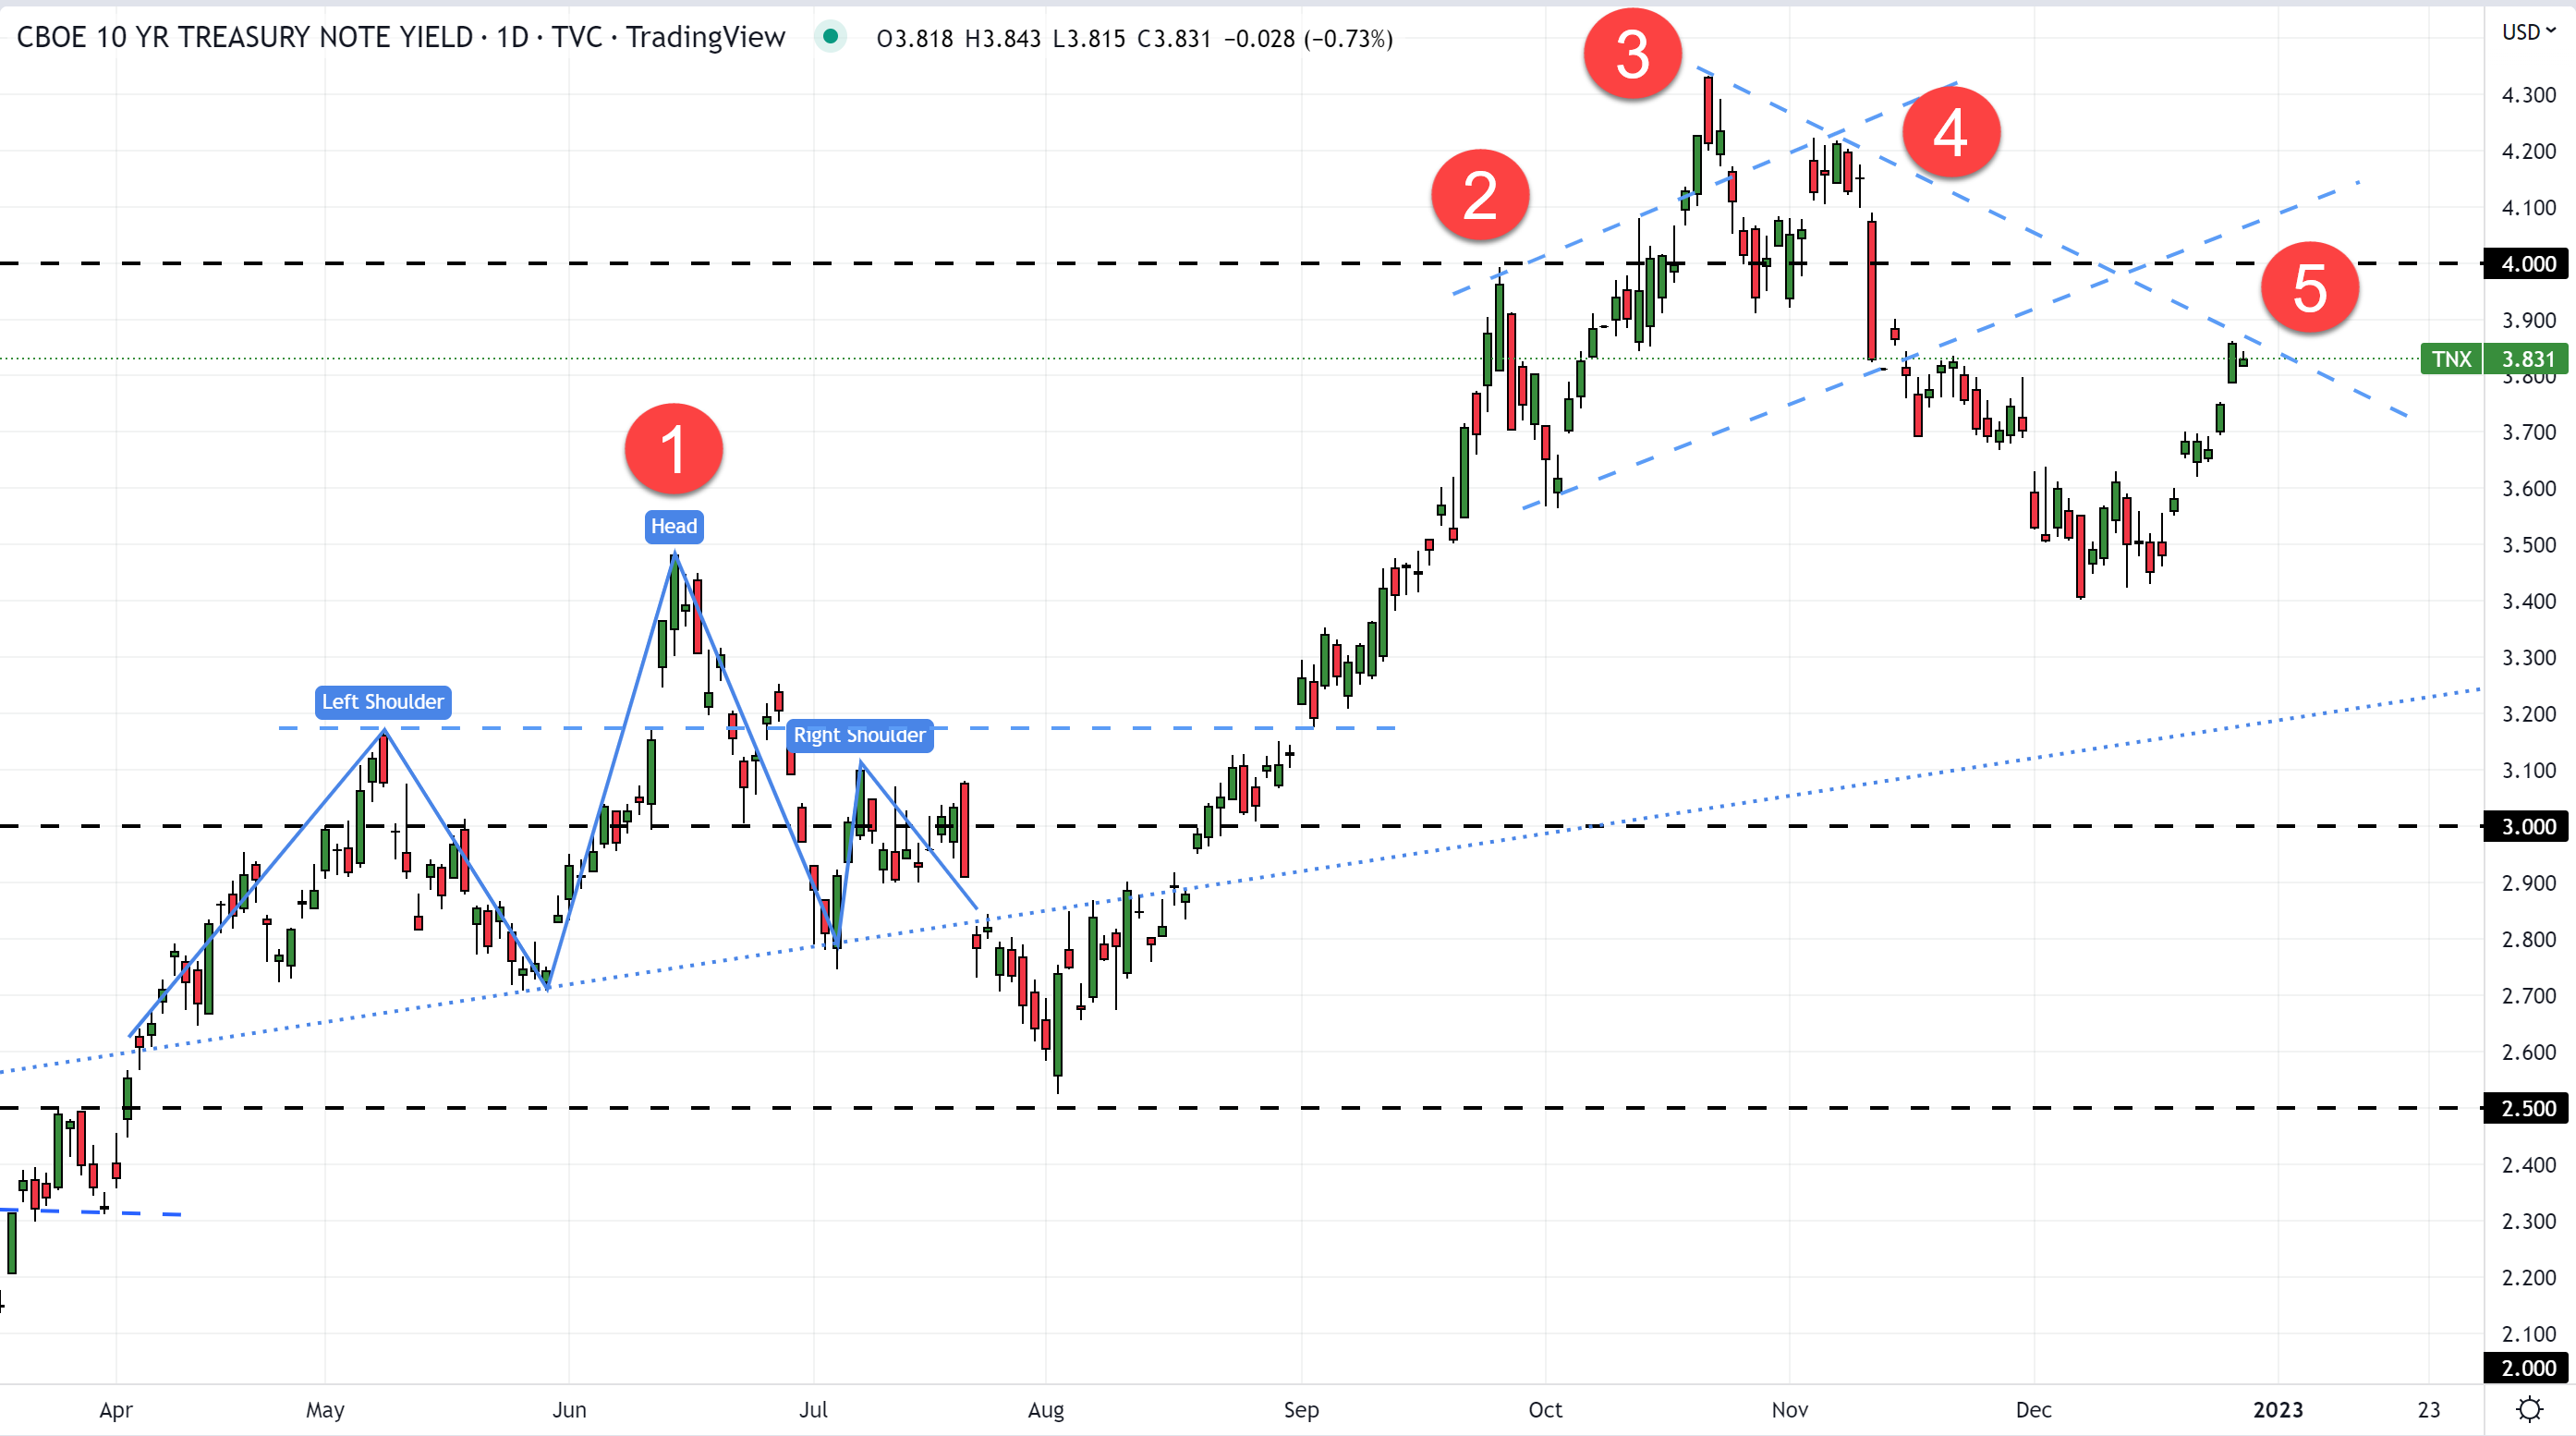
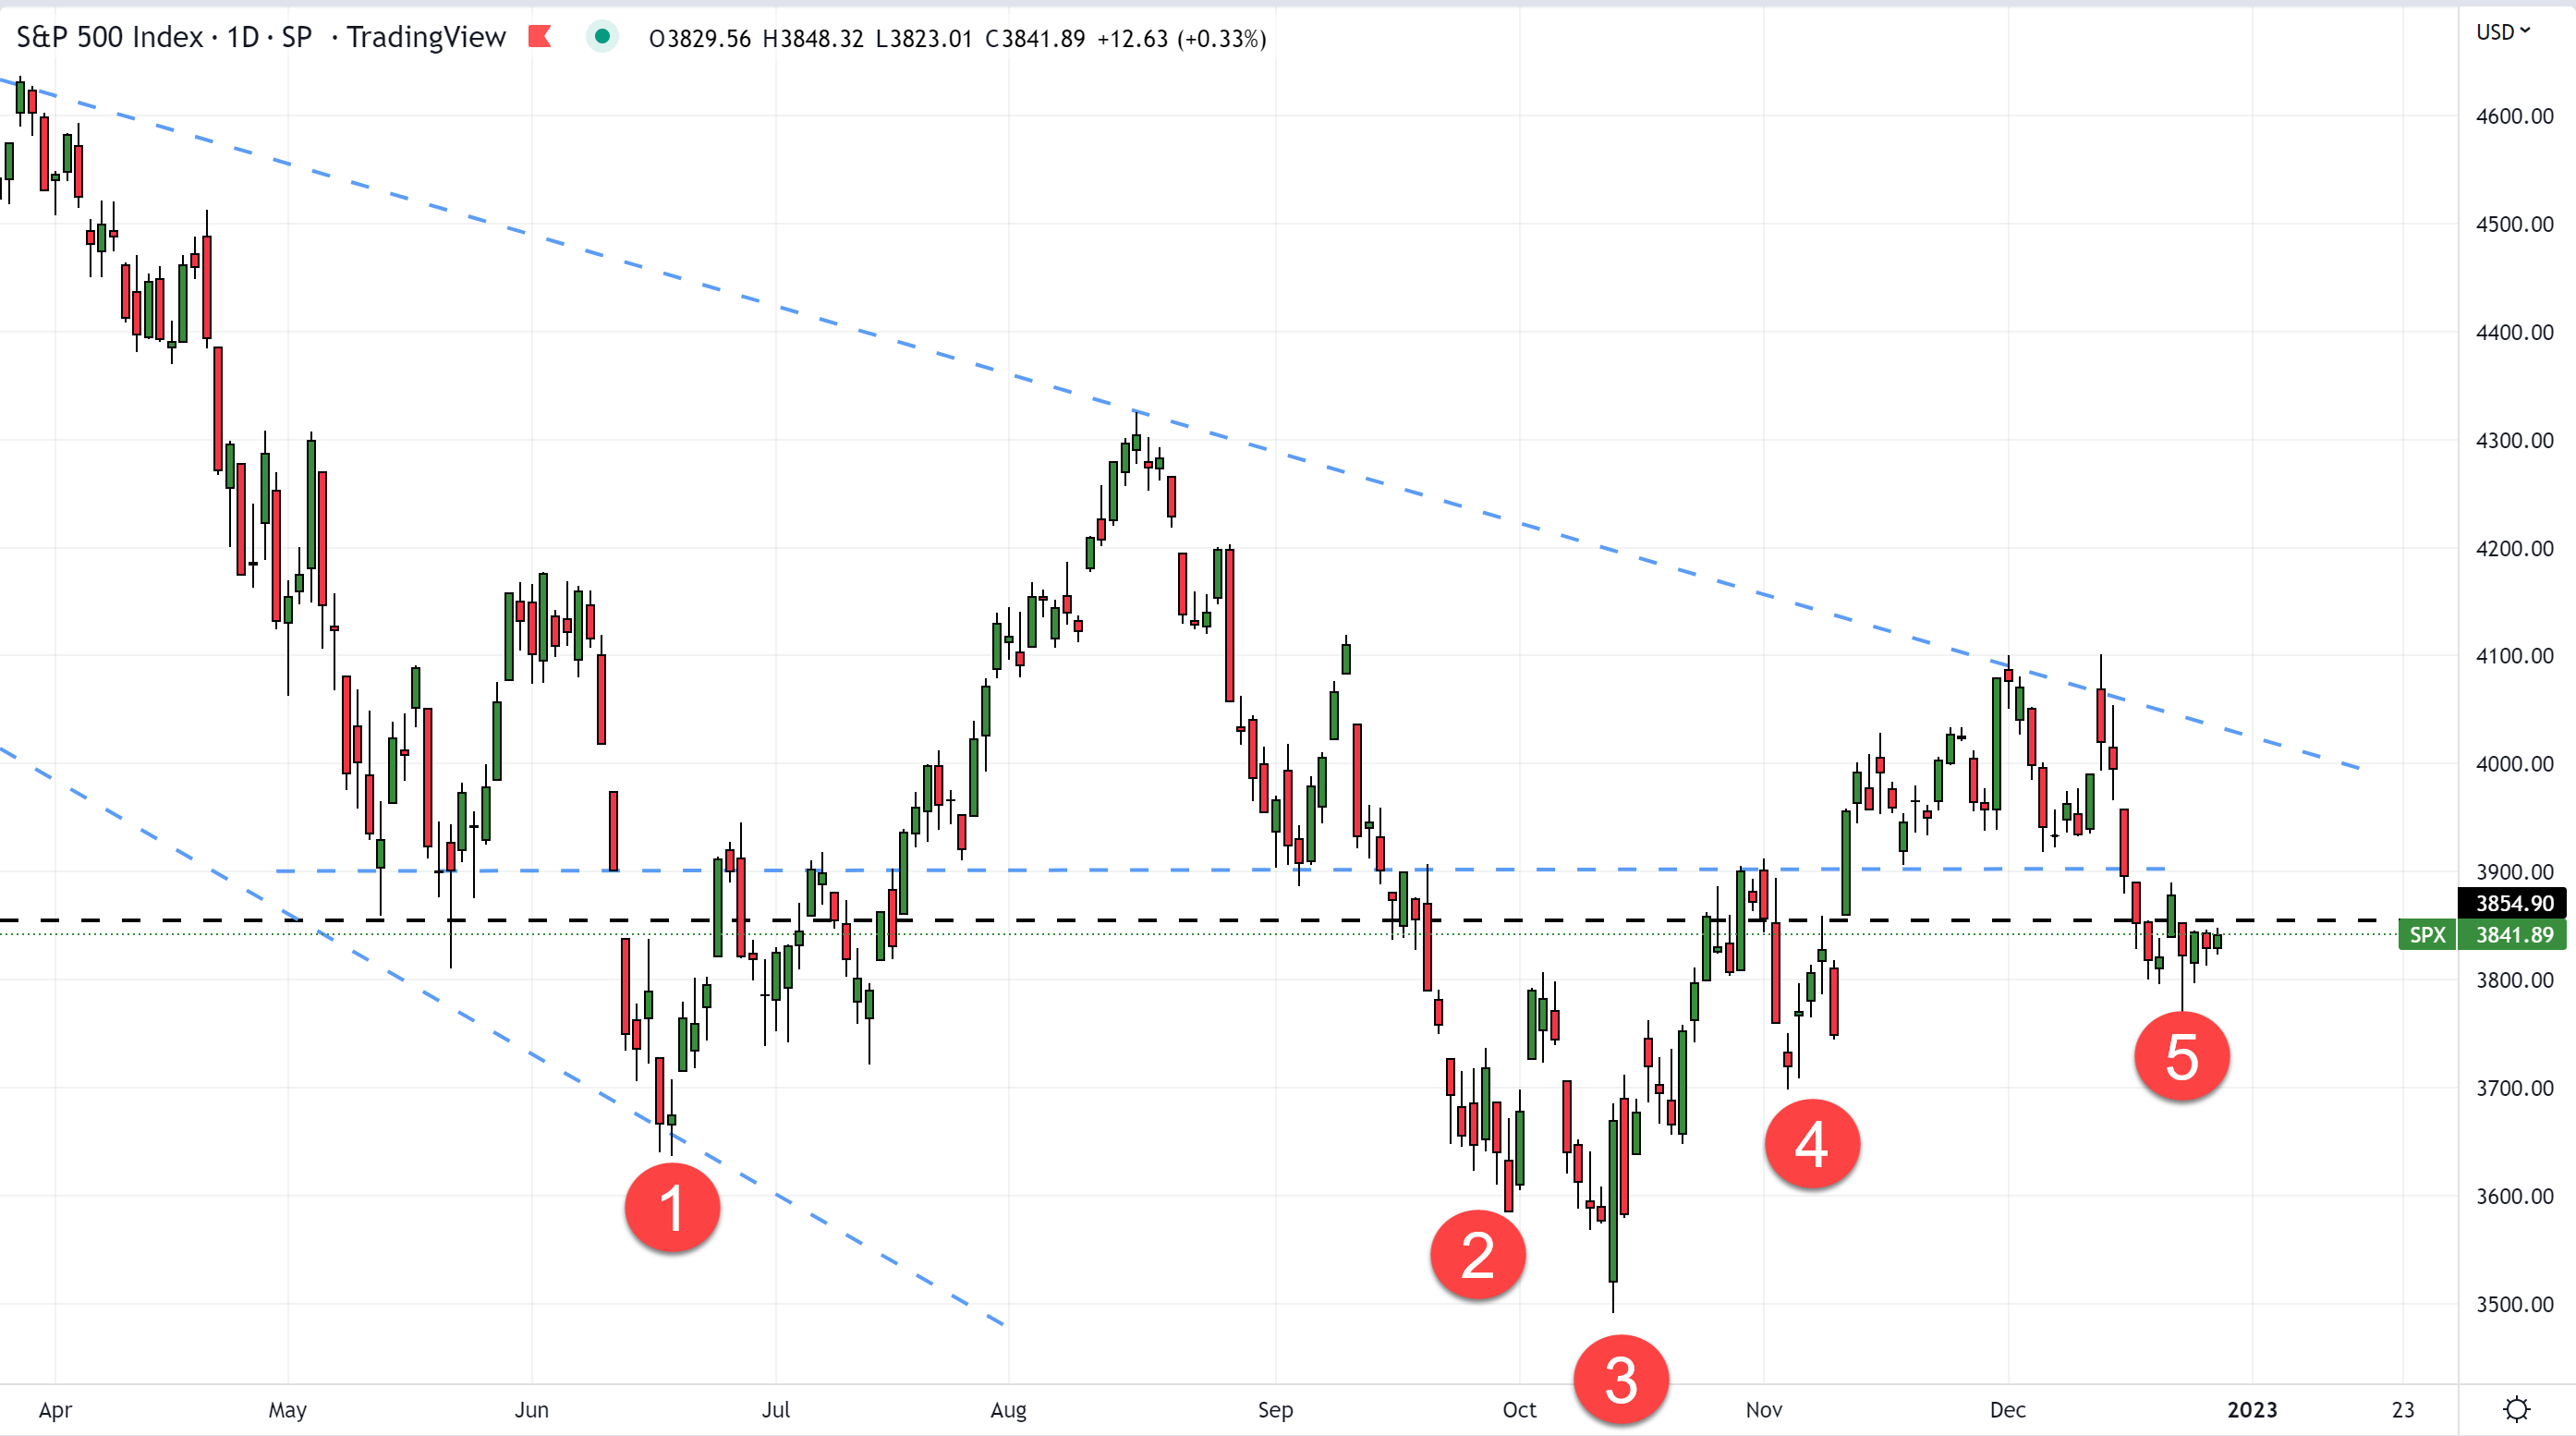
Here’s how the relationship has played out since June…
- Mid-June
- The TNX climbed to a new high of 3.5%
- The SPX dropped into bear-market territory and finally found support at ~3,650
- Late September
- The TNX climbed to 4% for the first time since 2010
- The SPX dropped to a new low at 3,600
- Mid-October
- The TNX jumped to a higher high of 4.3% for the first time since the Financial Crisis in 2008
- The SPX fell to a lower low at 3,500
- Early November
- The TNX established a lower high at 4.2%
- The SPX established a higher low at 3,700
- Now (Late December)
- The TNX has climbed back up to 3.8% after falling to 3.4%
- The SPX has dropped back down to 3,800 after challenging long-term down-trending resistance at 4,100
As you can see, when the TNX forms higher highs, the SPX forms lower lows. The opposite is also true. When the TNX forms lower highs, the SPX forms higher lows.
The Bottom Line
The TNX has been forming lower highs since late October. This has led to the SPX forming higher lows, which has been a good thing for the index.
However, the TNX is on the cusp of breaking through down-trending resistance at 3.9% and forming a higher high…
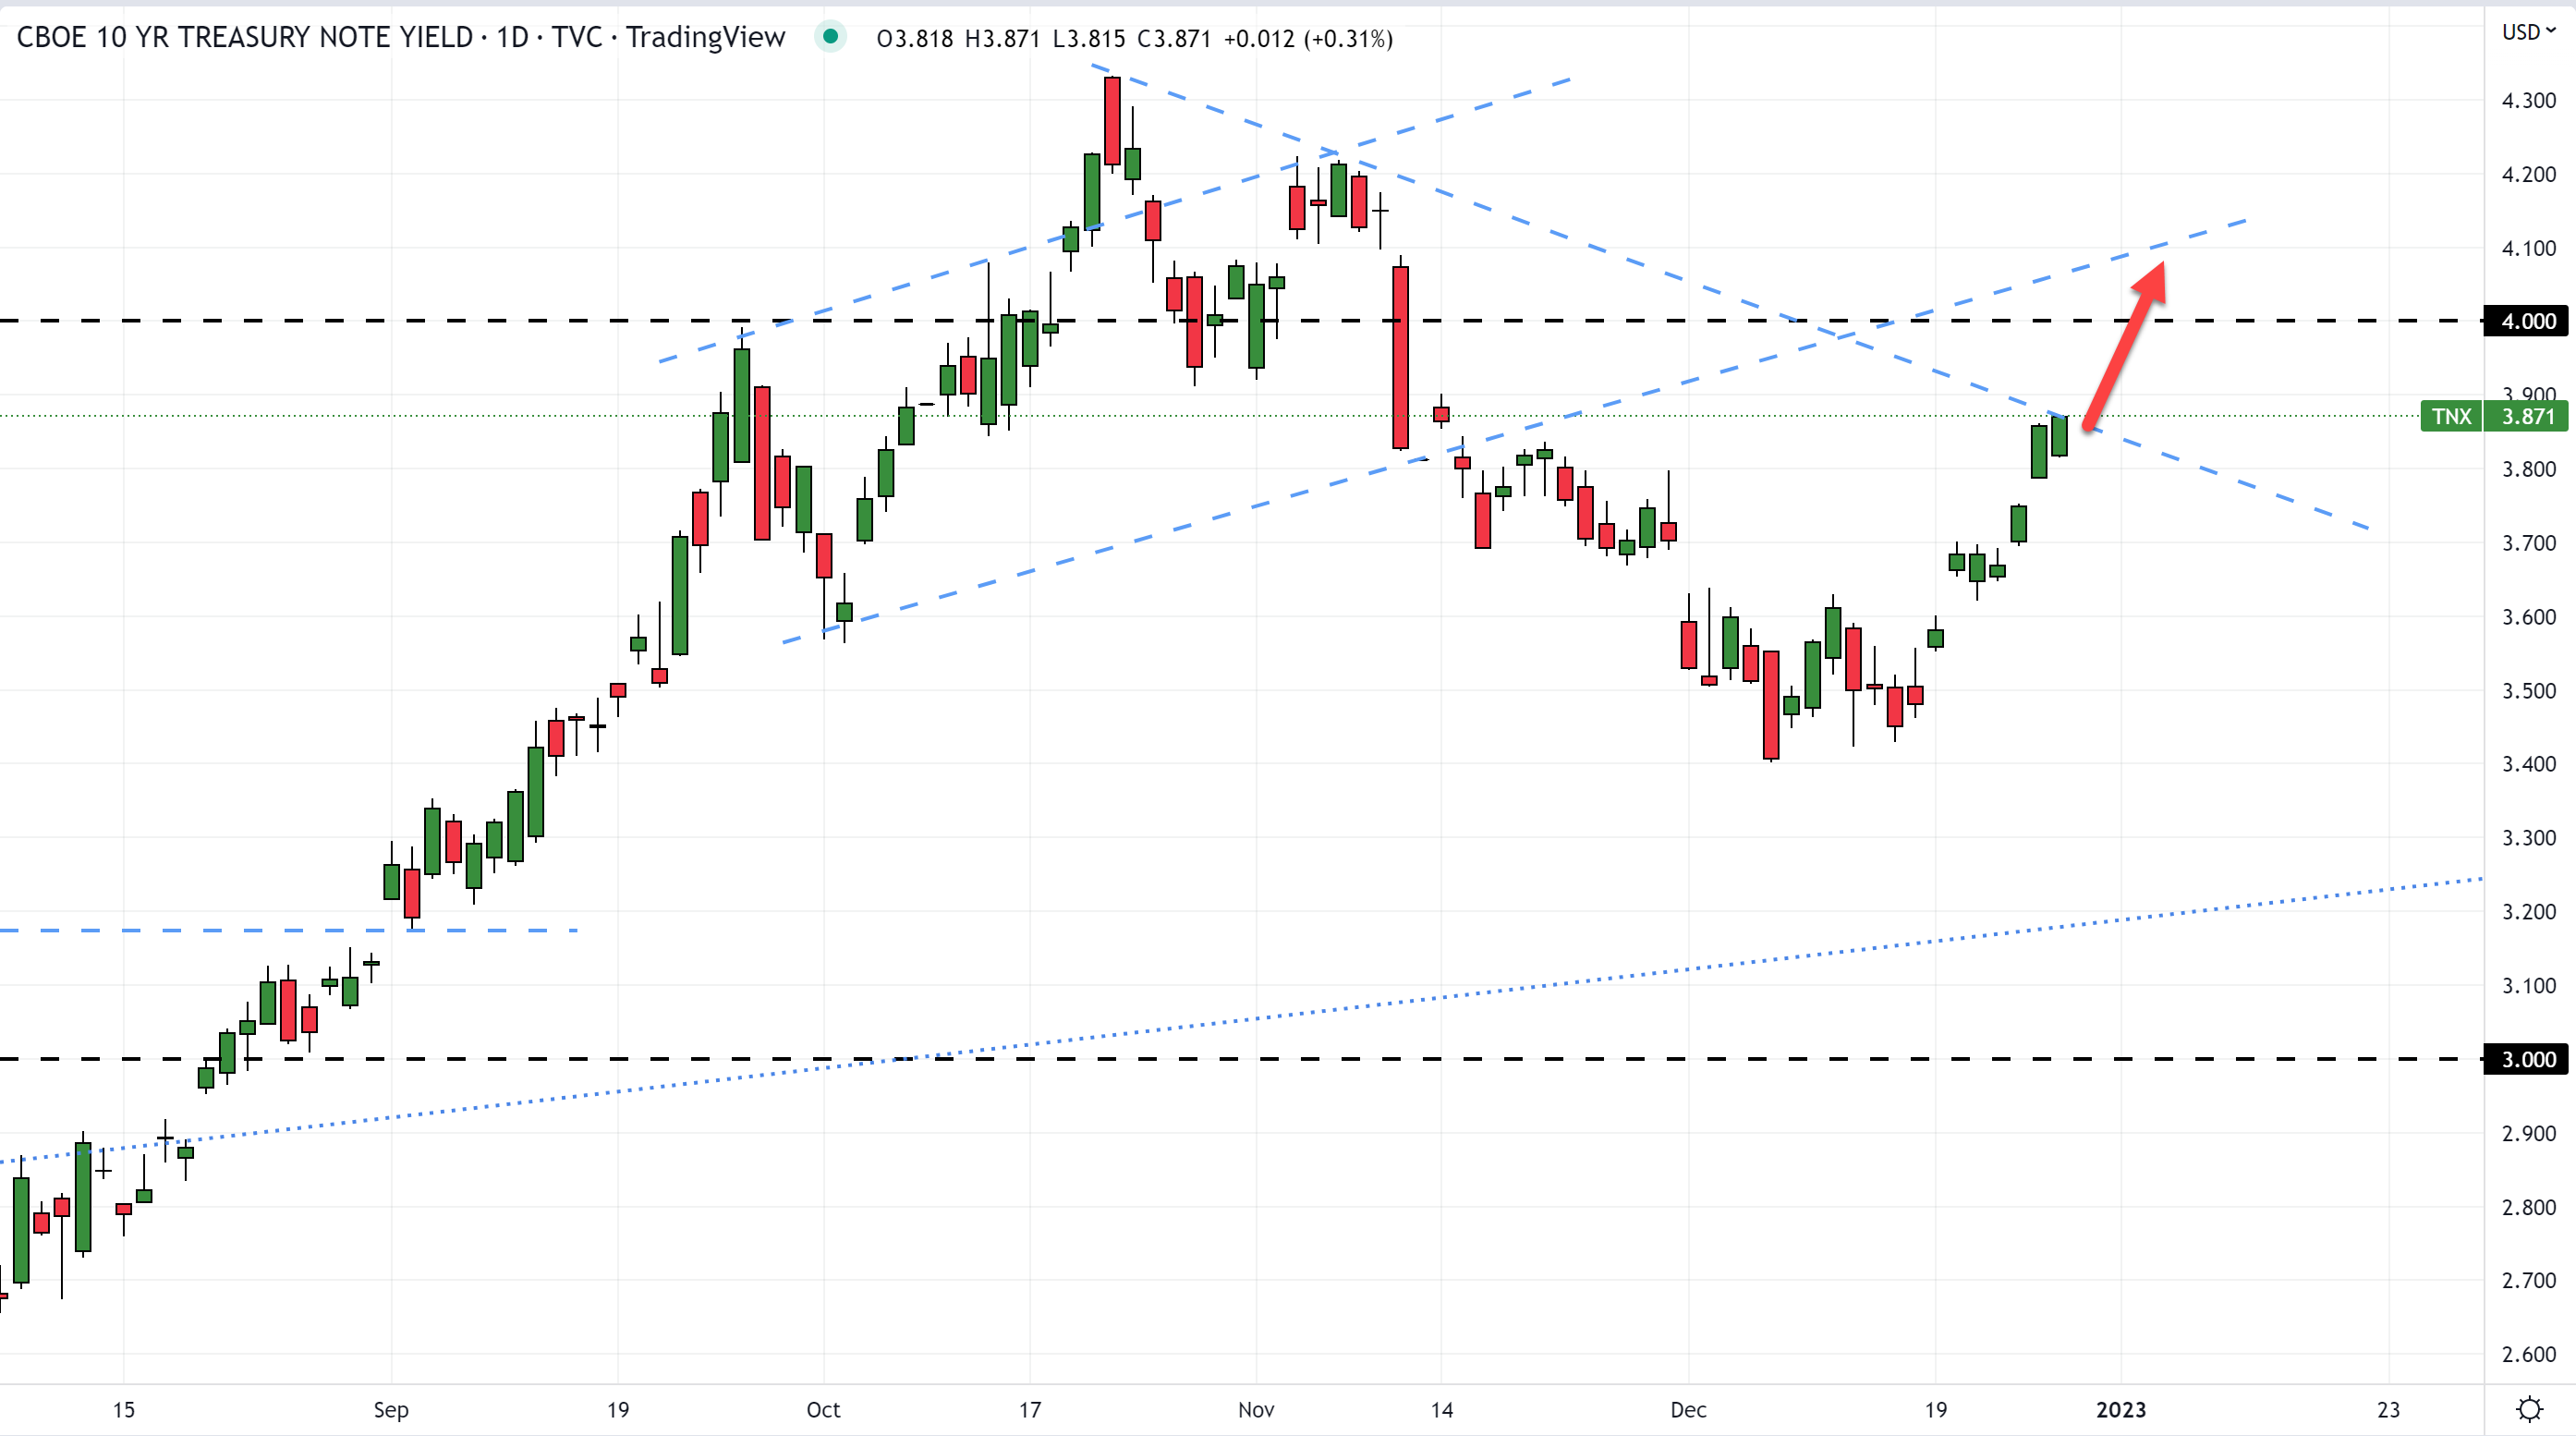
If the TNX breaks through down-trending resistance, we don’t think the SPX will be able to break out of bear-market territory.
If the TNX breaks above 4.0%, look for the SPX to drop toward 3,600 – or lower.
We’ll keep you updated as things progress.


Comments
Post a Comment