SPX vs TNX
SPX vs TNX
To recap, we have seen a direct inverse correlation between the value of the TNX and the value of the S&P 500 (SPX) for the past seven months. When the TNX forms lower highs, the SPX forms higher lows.
That relationship appears to be carrying forward into 2023 (see Figs. 1 and 2).
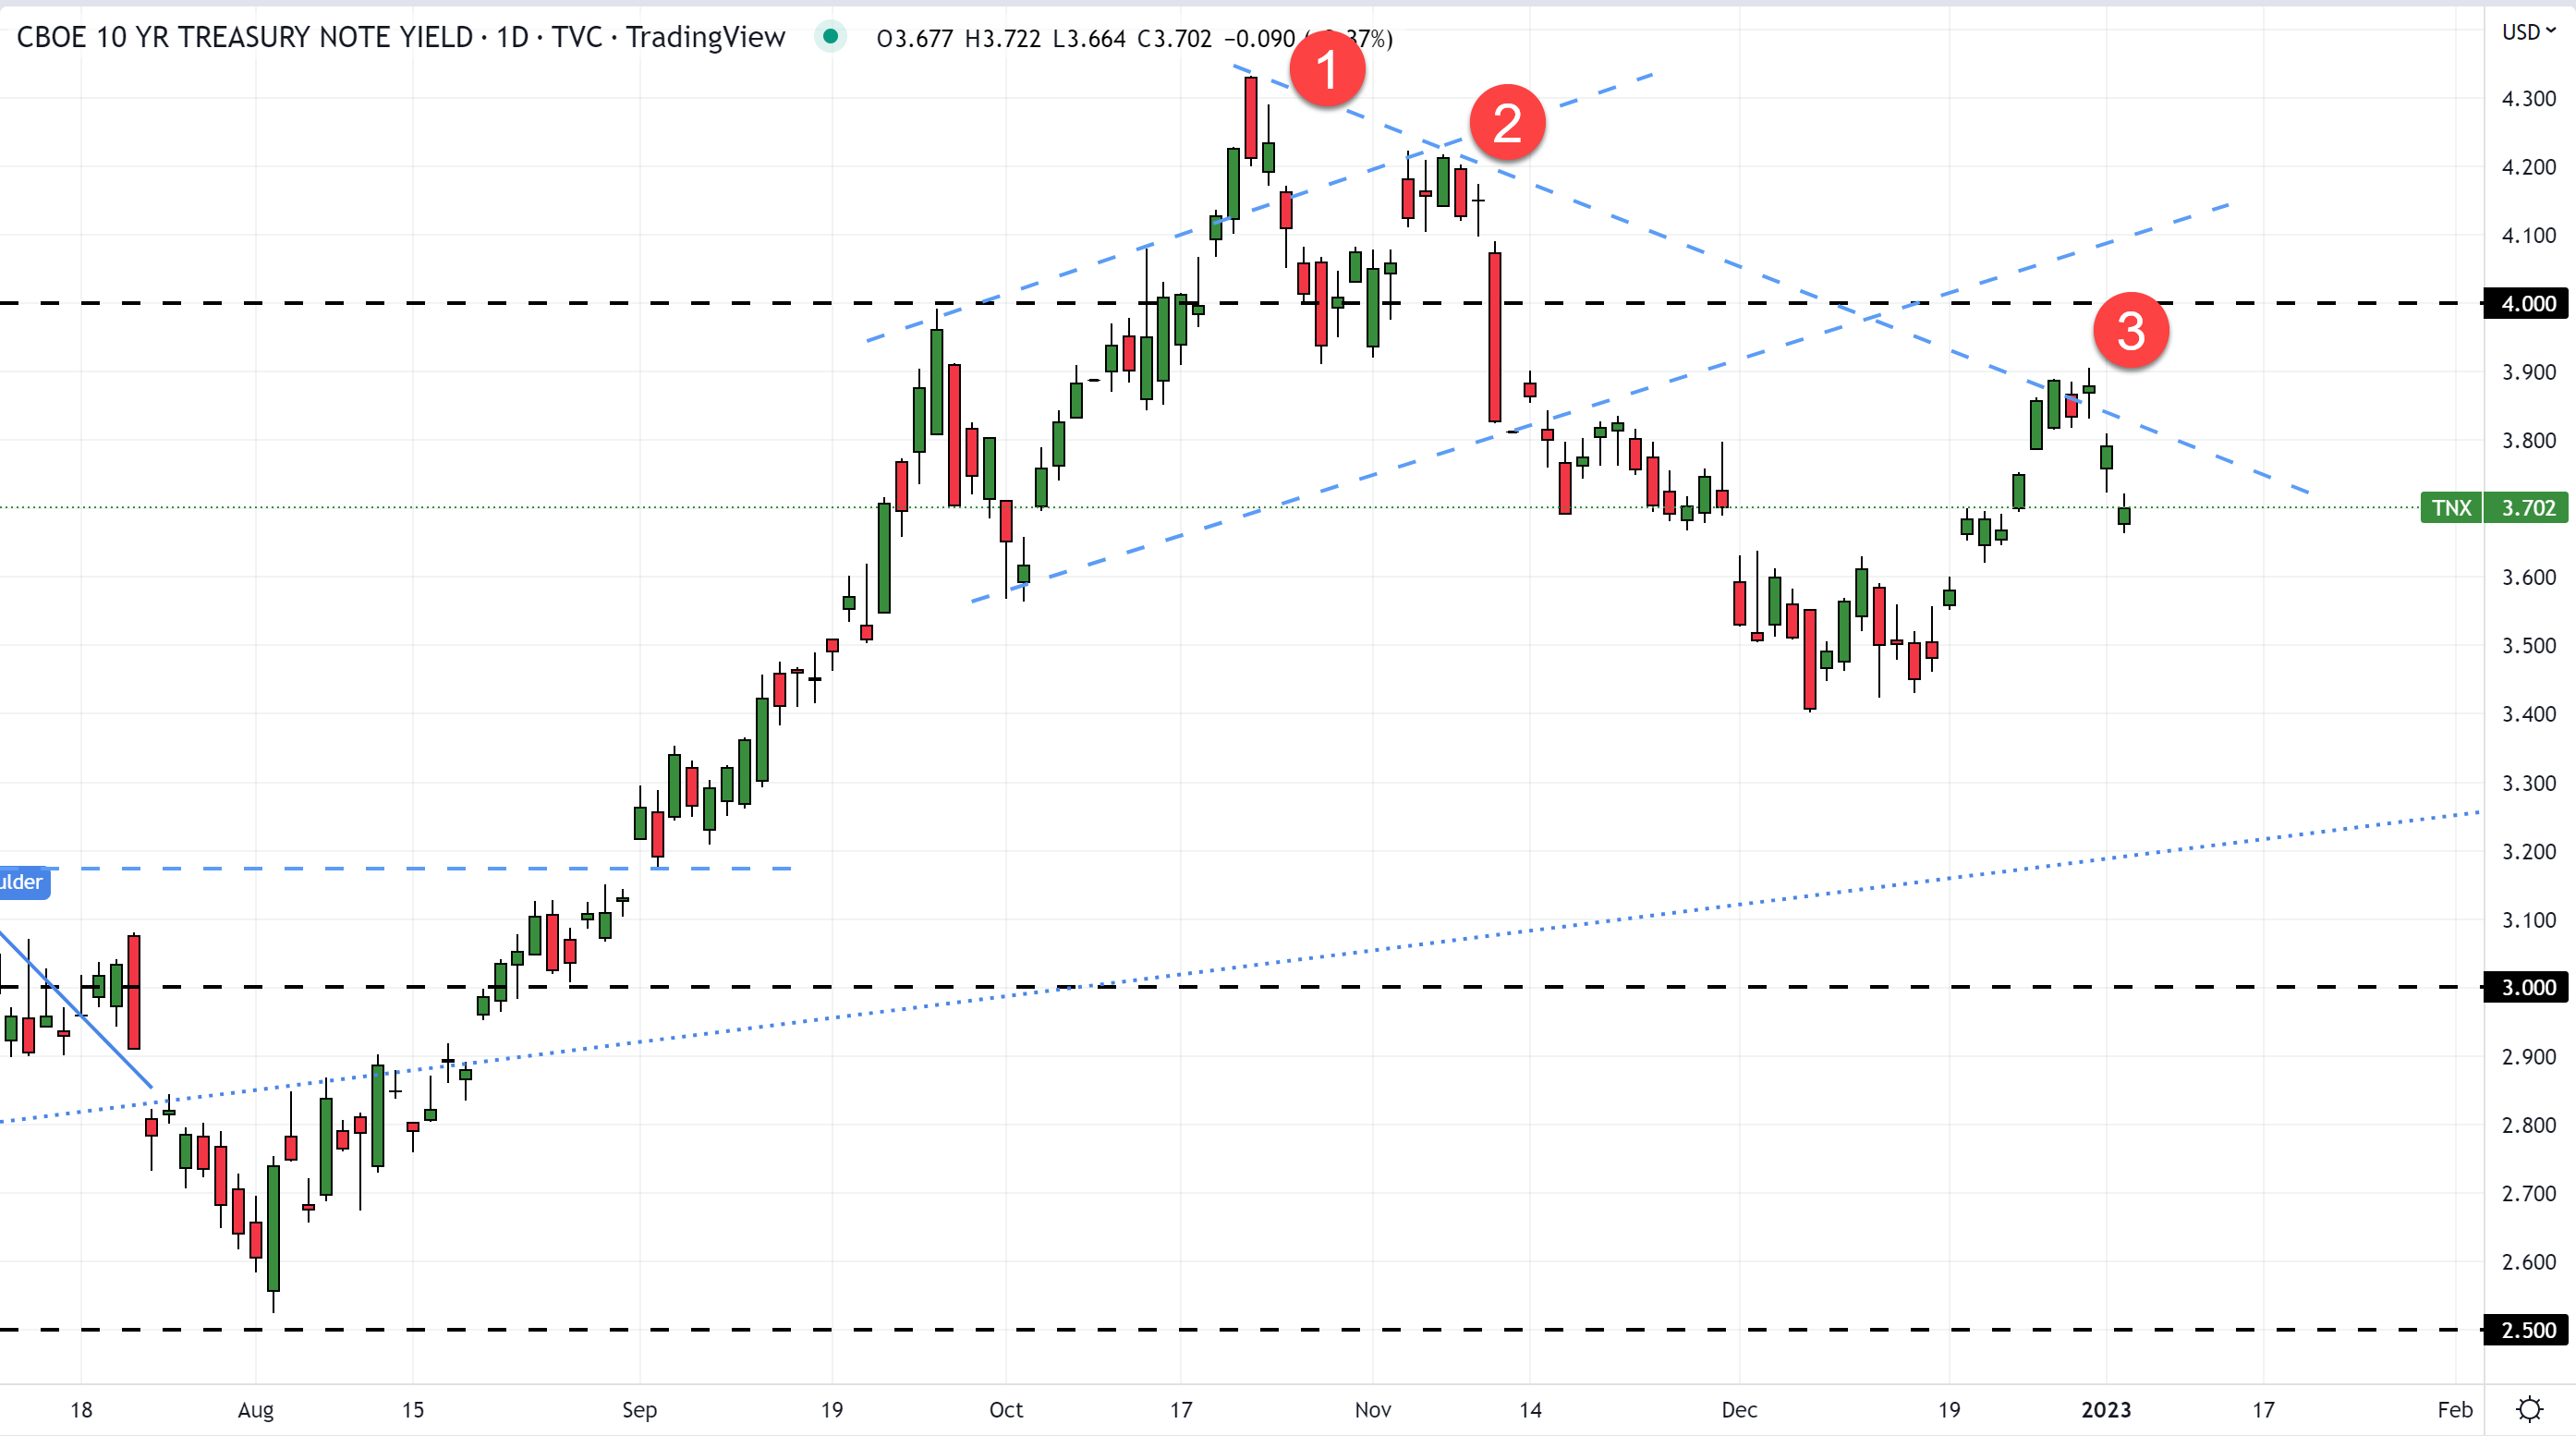
Fig. 1 – Daily Chart of 10-year Treasury Yield (TNX)
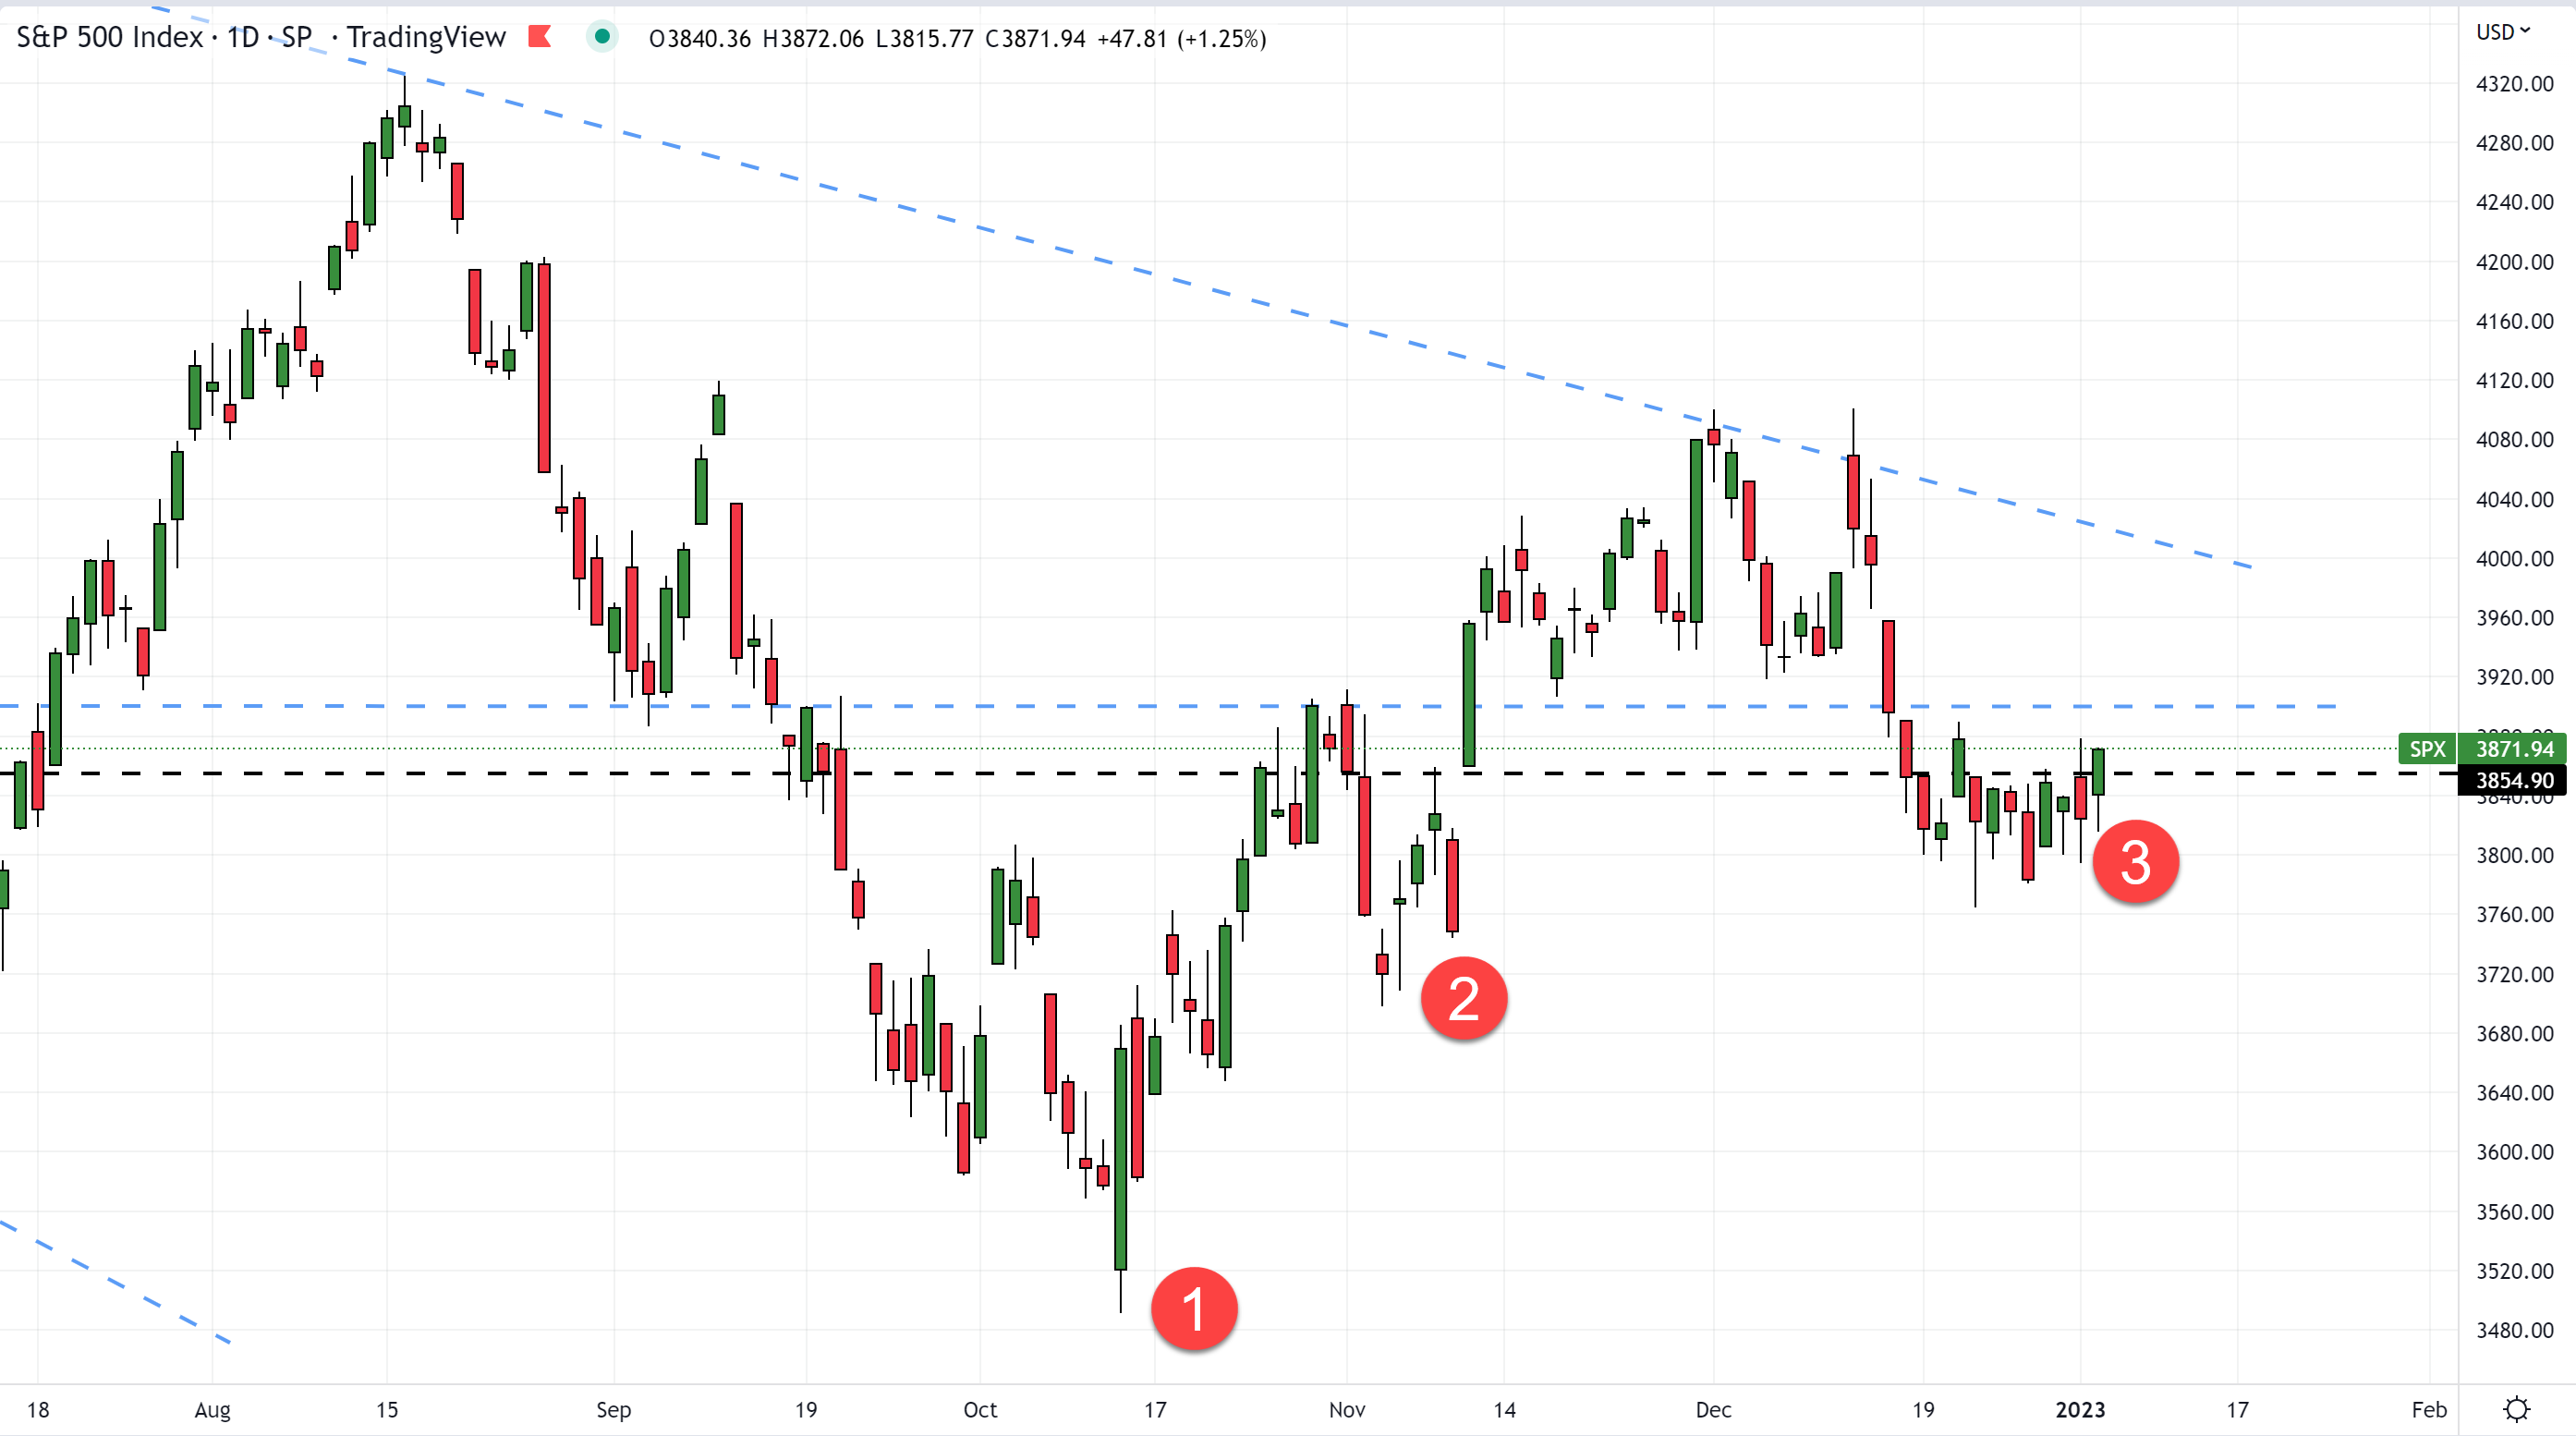
Fig. 2 – Daily Chart of S&P 500 (SPX)
Here’s how the relationship has played out since October…
- Mid-October
- The TNX jumped to a higher high of 4.3% for the first time since the Financial Crisis in 2008
- The SPX fell to a lower low at 3,500
- Early November
- The TNX established a lower high at 4.2%
- The SPX established a higher low at 3,700
- Now (Early January)
- The TNX has hit resistance at 3.9% and has pulled back to 3.7%
- The SPX has found support at 3,800 and is climbing back above 3,854.90
Where the TNX and SPX go from here will depend on Wall Street’s expectations for the Fed, because…
- If Wall Street starts to anticipate more interest-rate hikes from the Fed during 2023, the TNX will likely climb, and the SPX will likely fall.
- But if Wall Street starts to anticipate fewer interest-rate hikes from the Fed during 2023, the TNX will likely fall, and the SPX will likely climb.


Comments
Post a Comment