Percentage Price Oscillator or PPO
Percentage Price Oscillator or PPO
Stockcharts.com provides a great definition of the Percentage Price Oscillator (PPO), which “is a momentum oscillator that measures the difference between two moving averages as a percentage of the larger moving average”. The Percentage Price Oscillator is shown with a signal line, a histogram, and a centerline. Signals are generated with signal line crossovers, center line crossovers, and divergences, or surprising differences.
The PPO reflects the convergence and divergence of two moving averages. PPO is positive when the shorter moving average is above the longer moving average. The indicator moves further into positive territory as the shorter moving average distances itself from the longer moving average. This reflects strong upside momentum.
The PPO is negative when the shorter moving average is below the longer moving average. Negative readings grow when the shorter moving average distances itself from the longer moving average (goes further negative). This reflects strong downside momentum.
The histogram represents the difference between PPO and its EMA, the signal line. The histogram is positive when PPO is above its EMA and negative when PPO is below its EMA. The PPO-Histogram can be used to anticipate signal line crossovers in the PPO.
I am setting the PPO at 13,21,8.
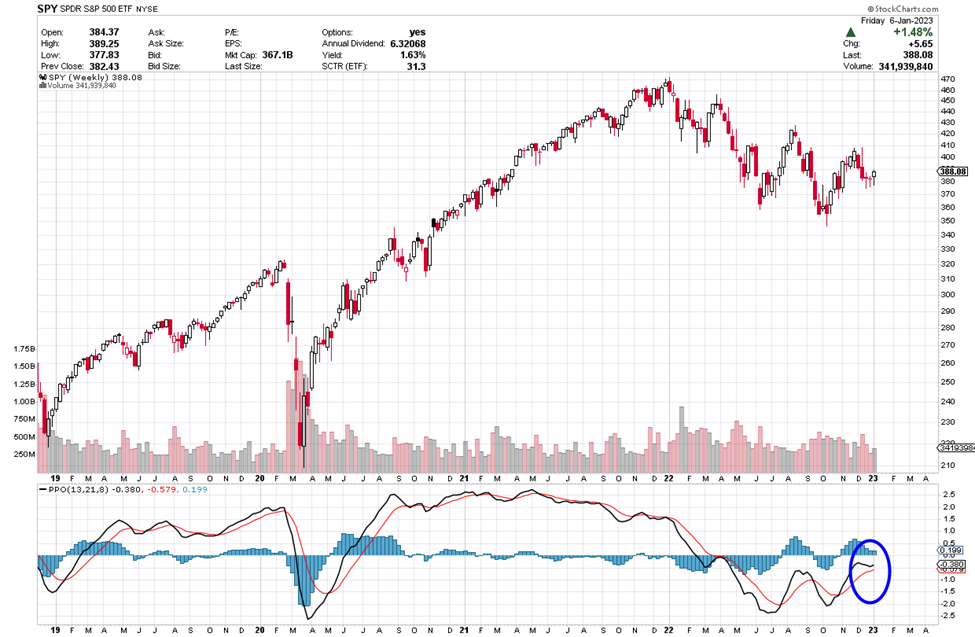
Let’s See Why This Signal Could Offer Potential Trade Info
Each candle on the chart represents price movement over a 5-day (week) period. Next week’s candle will start with Monday’s price movement and then each consecutive day of the week will be added or subtracted to Monday’s number to create the weekly candle.


Comments
Post a Comment