Inflation
I'm going to dive into inflation cycles with more than 100 years of data.
This will provide more insight into what we can expect from the cycles than going off of what a bunch of Fed economists might think or do.
Here's a chart of the year-over-year ("YOY") change in the Consumer Price Index ("CPI")...
|
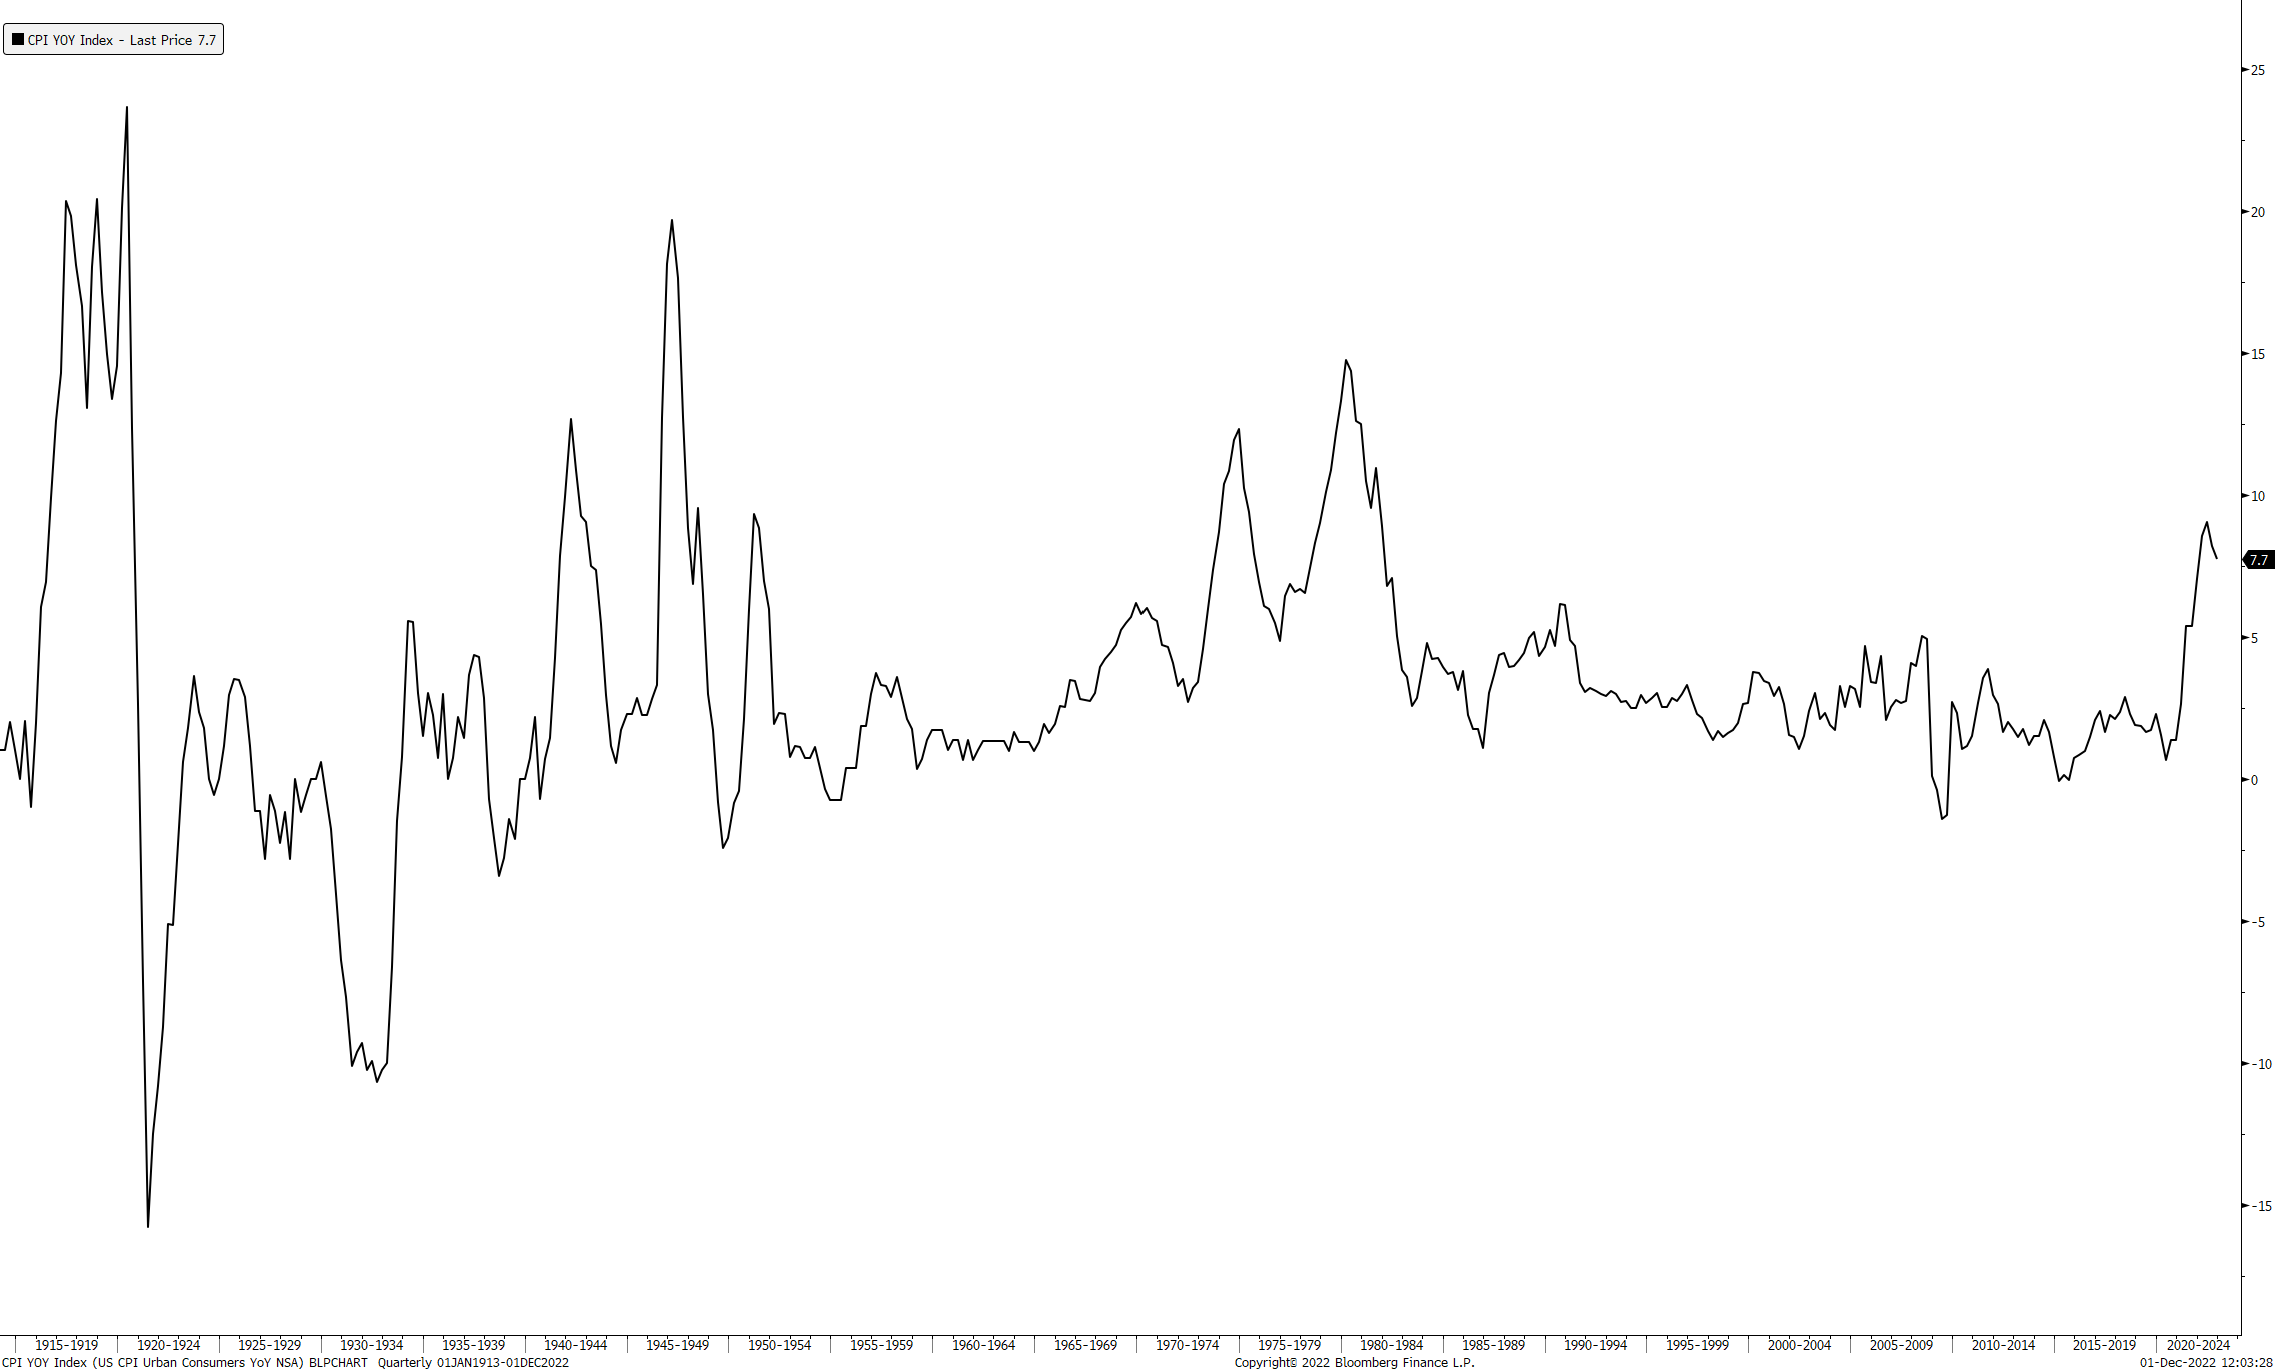
As you can see, this data goes back more than 100 years, to 1914... That's a lot of data to analyze. So I want to find a rhythm within this data that points to a larger cycle of inflation in the U.S.
I plugged this data into a cycle software program to find the strongest cycles. And here's the result...
|
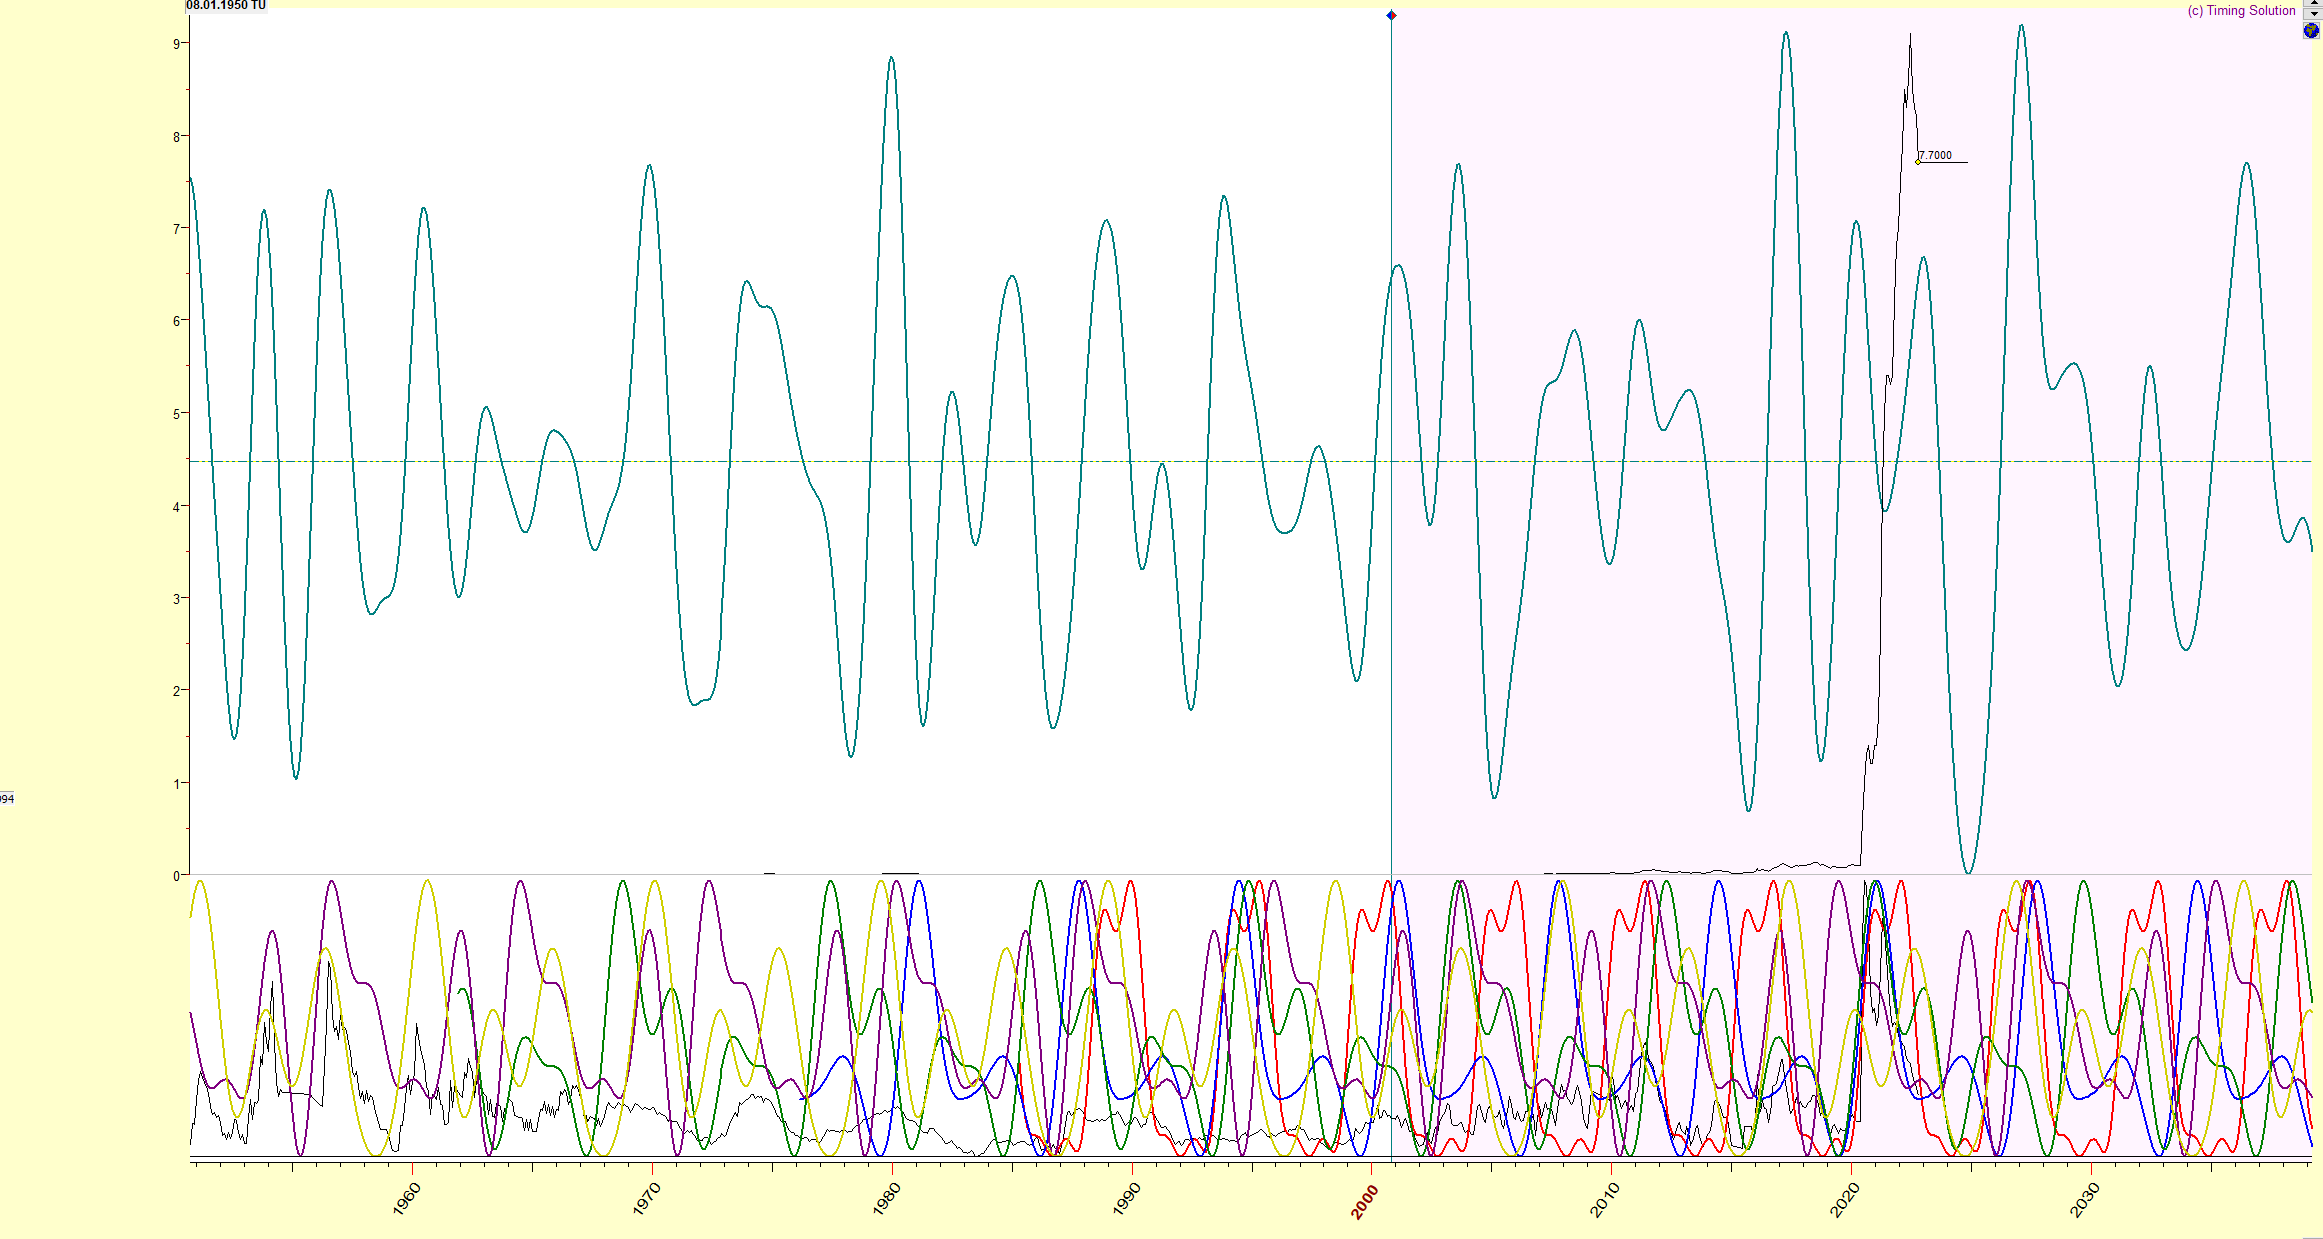
The green line at the top is the single major cycle and projection line into the future based on the various cycles below. It does look messy... In the next chart, you'll see that I cleaned it up and zoomed in to show you how this cycle works.
To save time, I'm not going to cover every decade going back to 1914. But you'll see how this cycle of inflation is pretty accurate. Here's the inflation line and the projection line from 1965 to 1992...
|
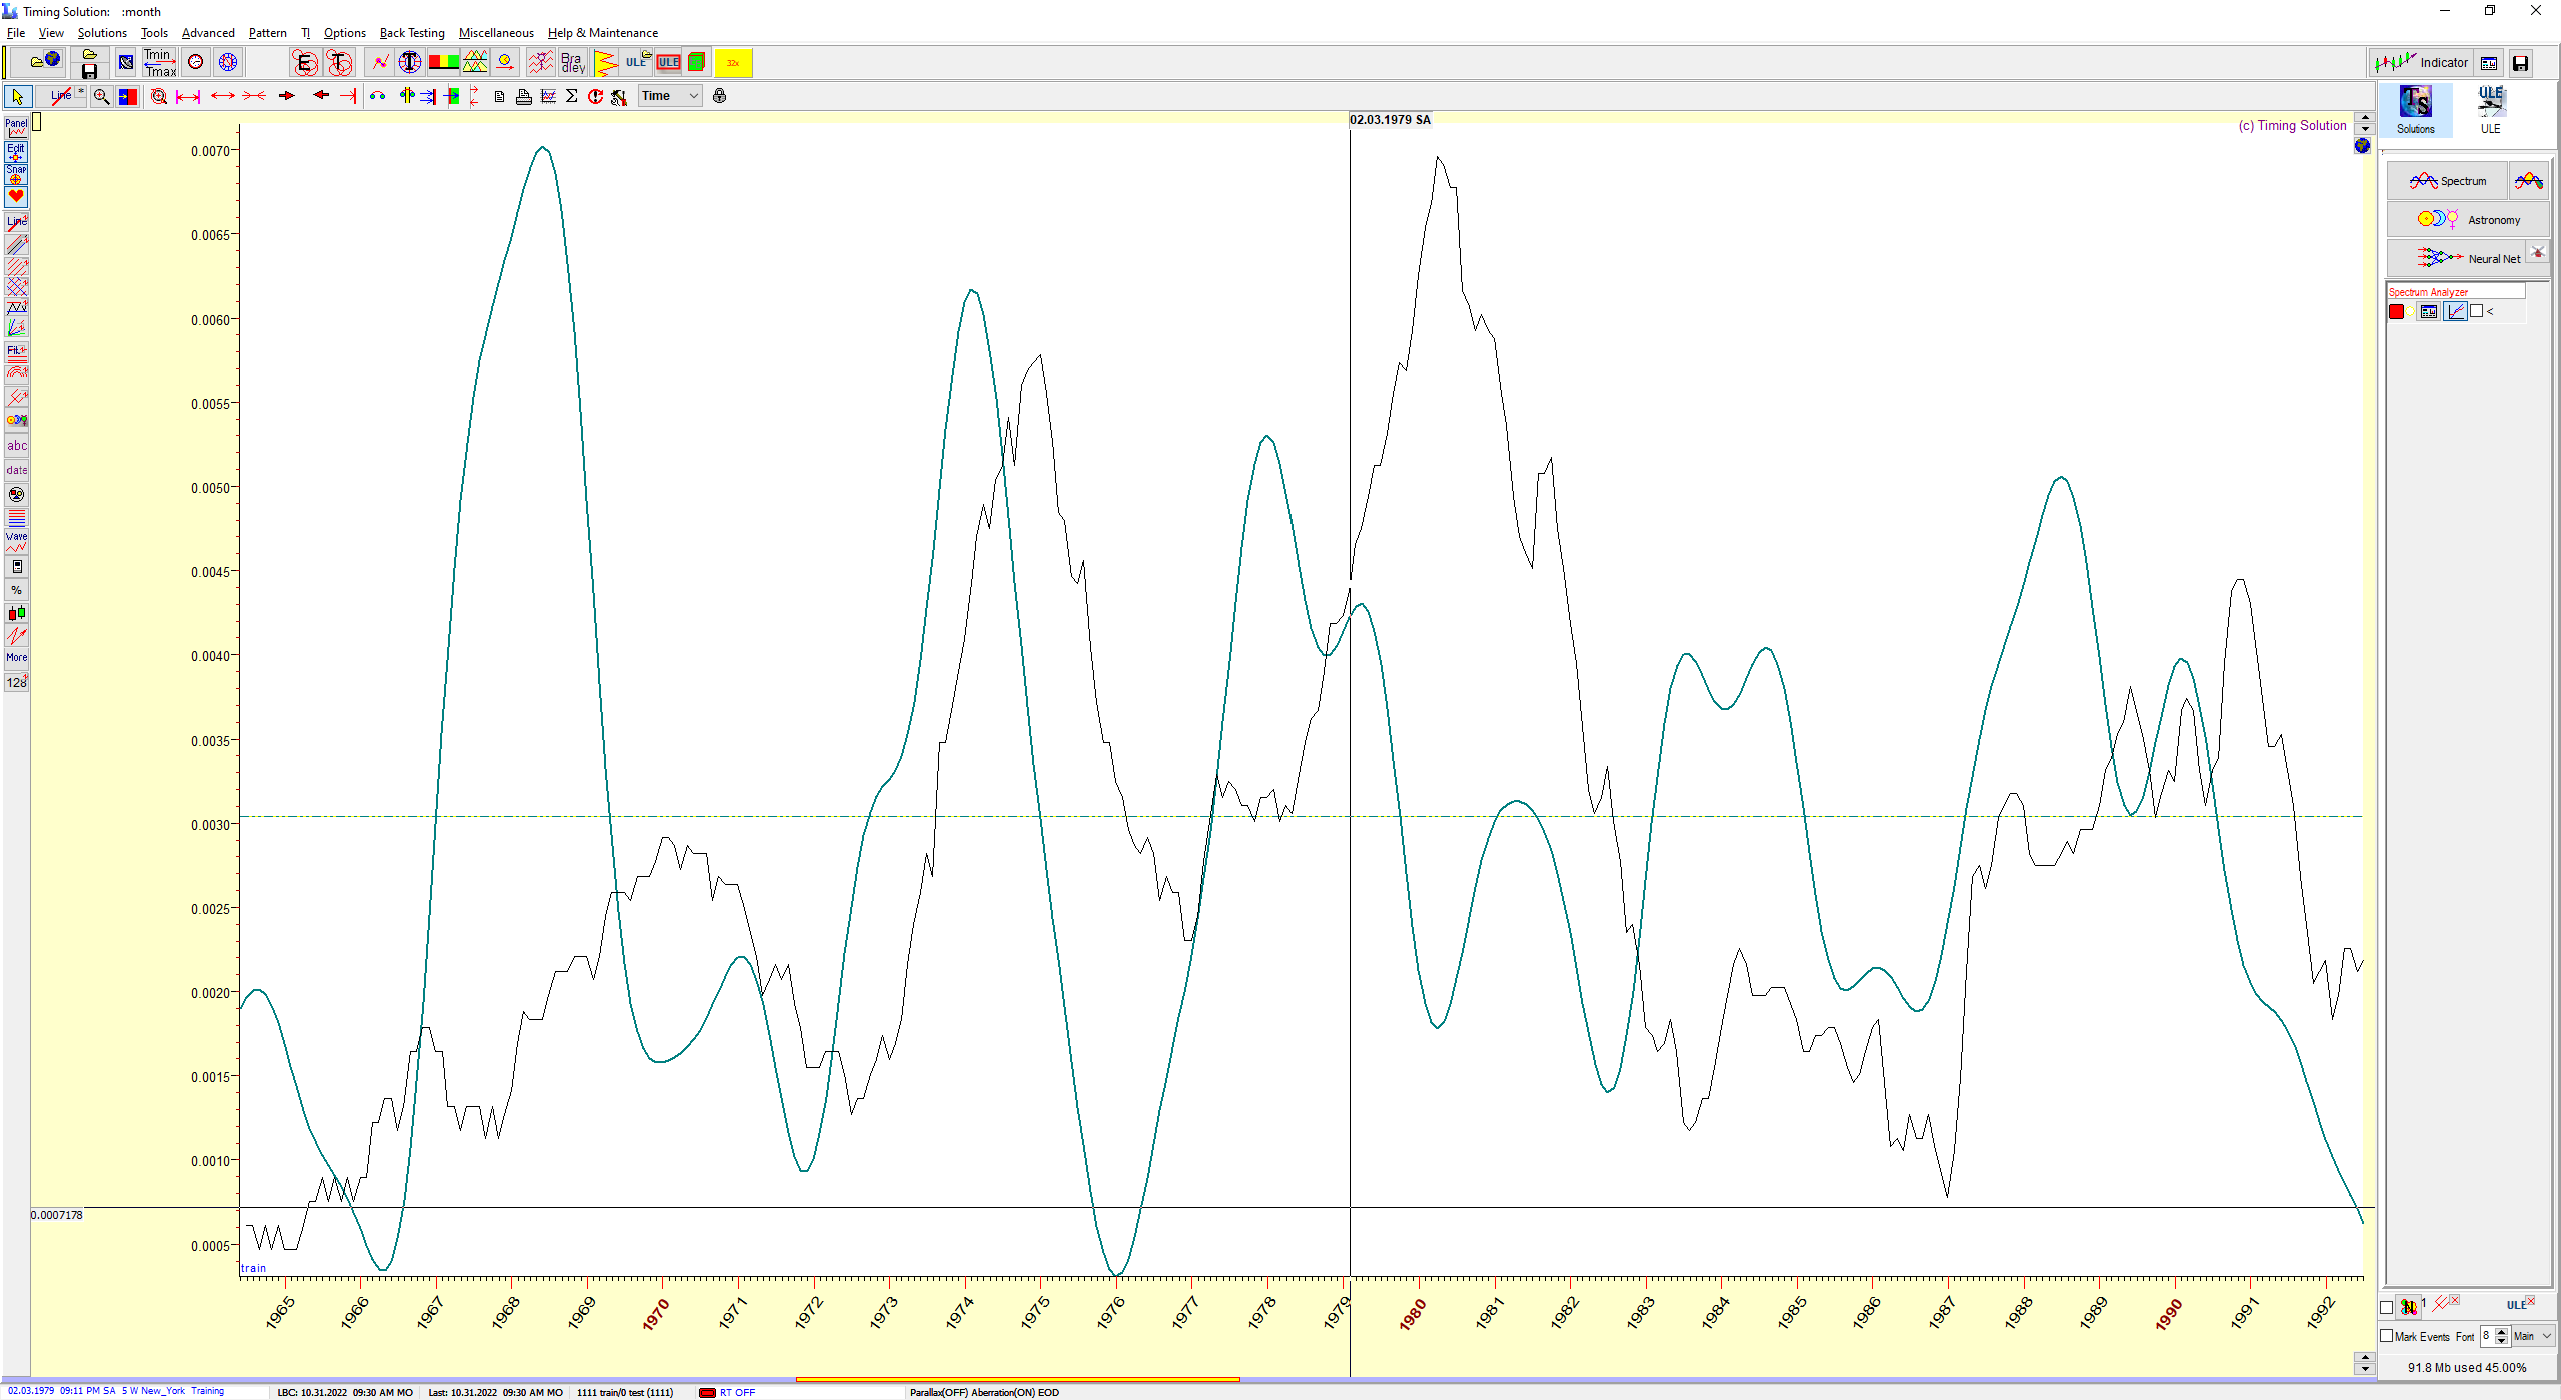
The thin black line above marks the actual YOY change of the CPI. The green line represents the major cycle we extracted (the projection line) from the CPI data in the previous chart.
As you can see, the projection line is quite accurate. Is it perfect? No...
Welcome to cycle analysis and trading in general. Yes, we strive for perfection... but we'll never get it. However, if we find an accurate correlation (like the one above), it improves our chances of success.
In the second chart above, you can see how this projection line generally marks important highs and lows. I'm showing you the past first for a reason... I'll explain how this projection line will help us in the next few years in just a bit.
Here's the inflation line and the projection line from 1993 to 2007...
|
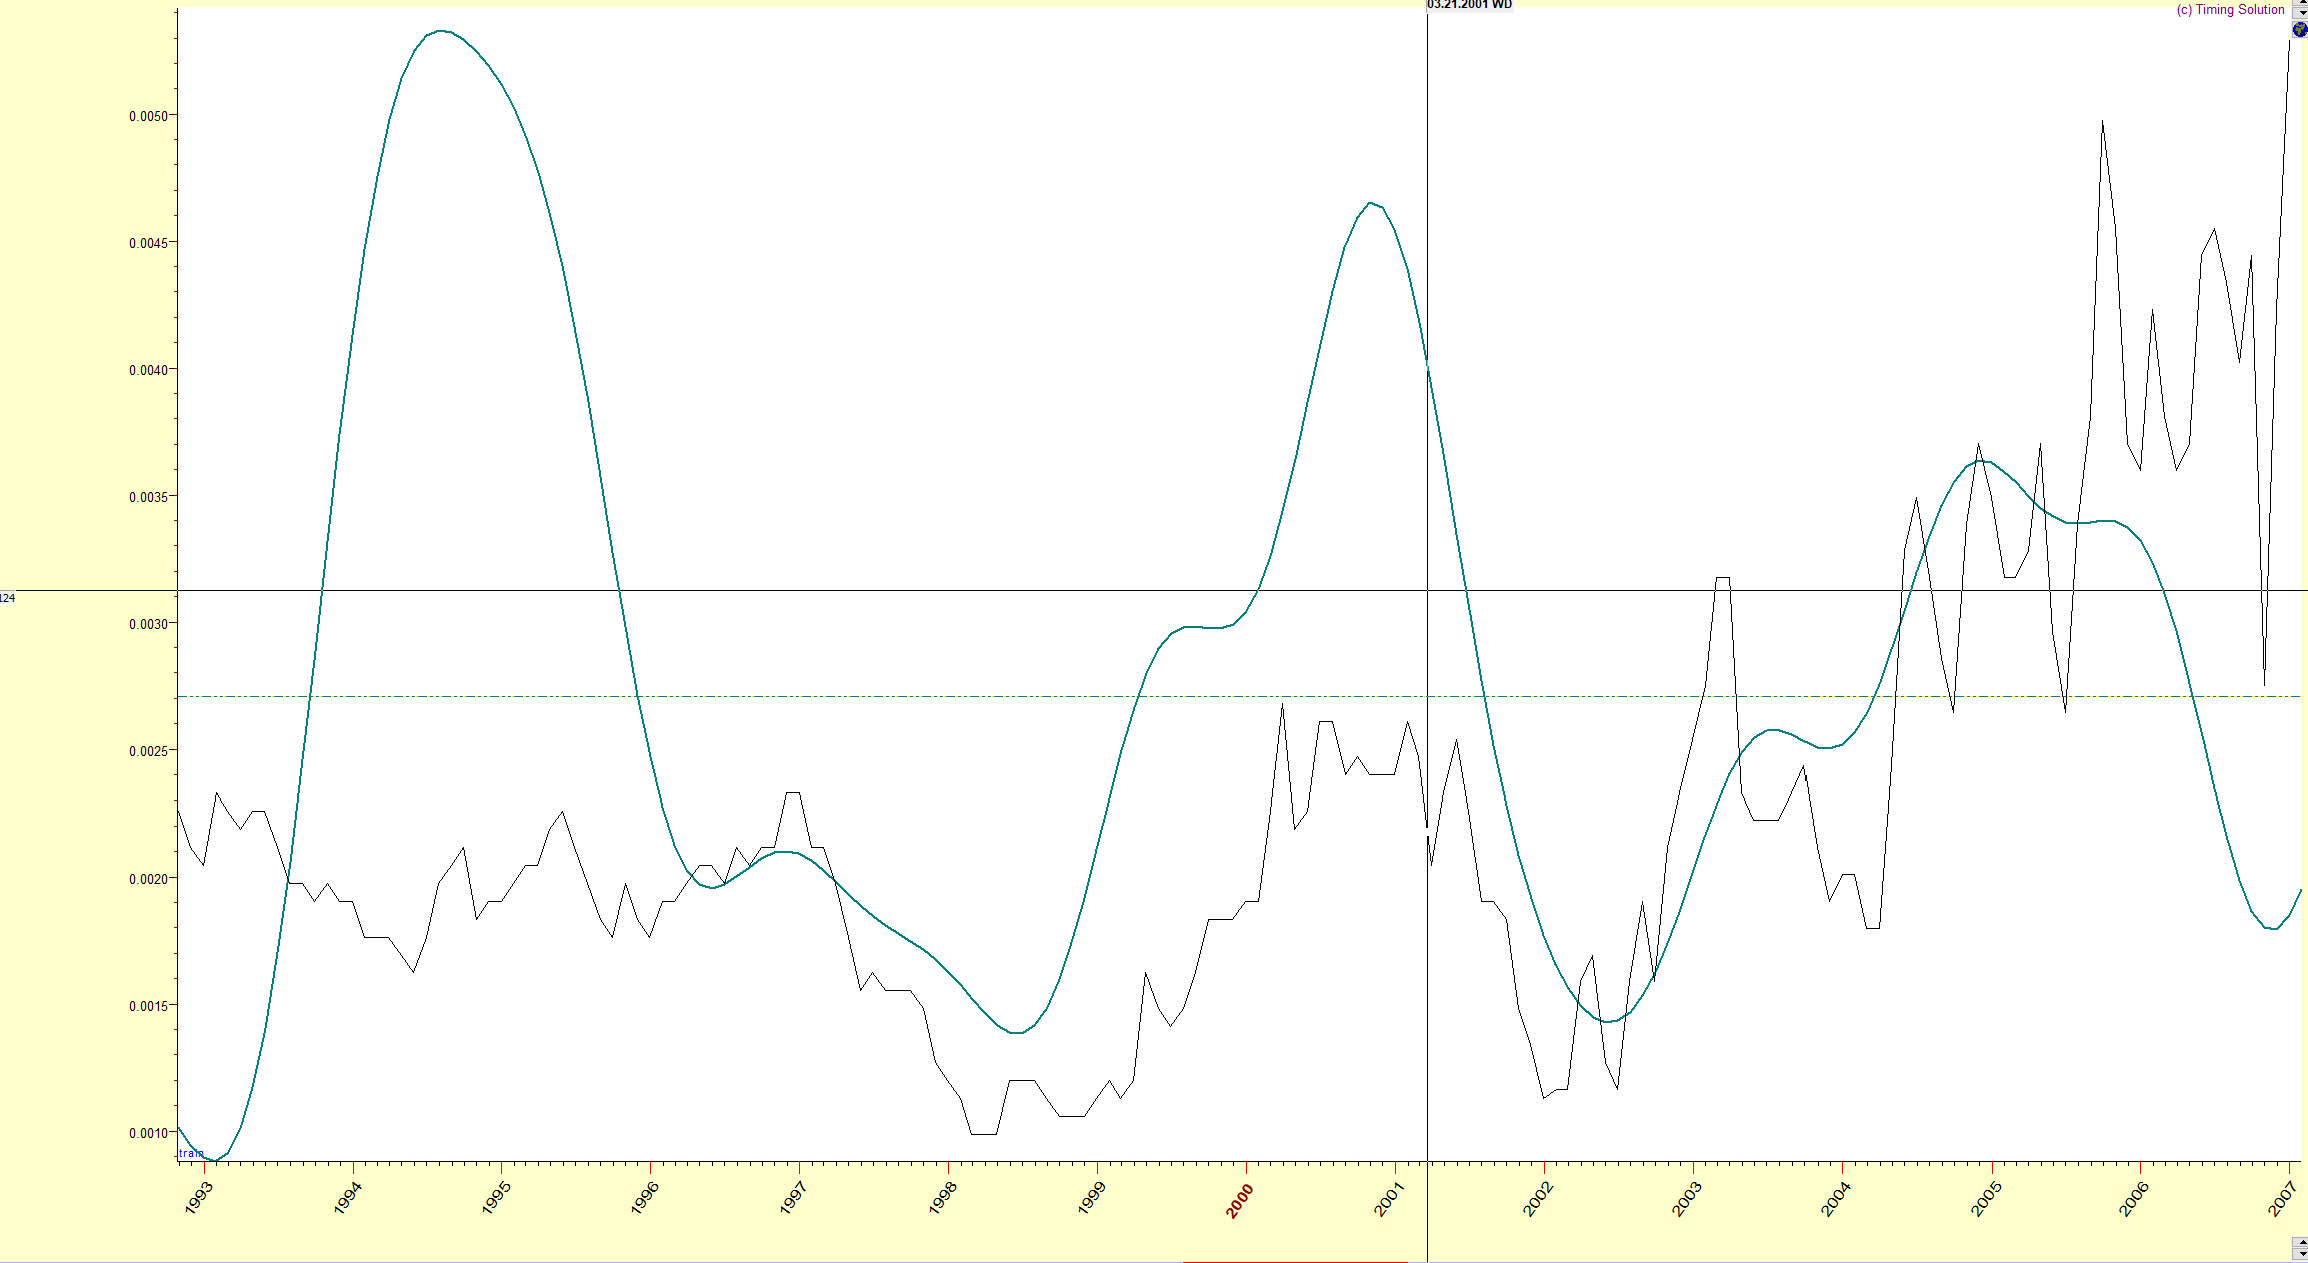
Once again, note how the green projection line is fairly accurate in predicting the yearly move of the CPI.
I'll zoom in even closer on 2015 to 2020...
|
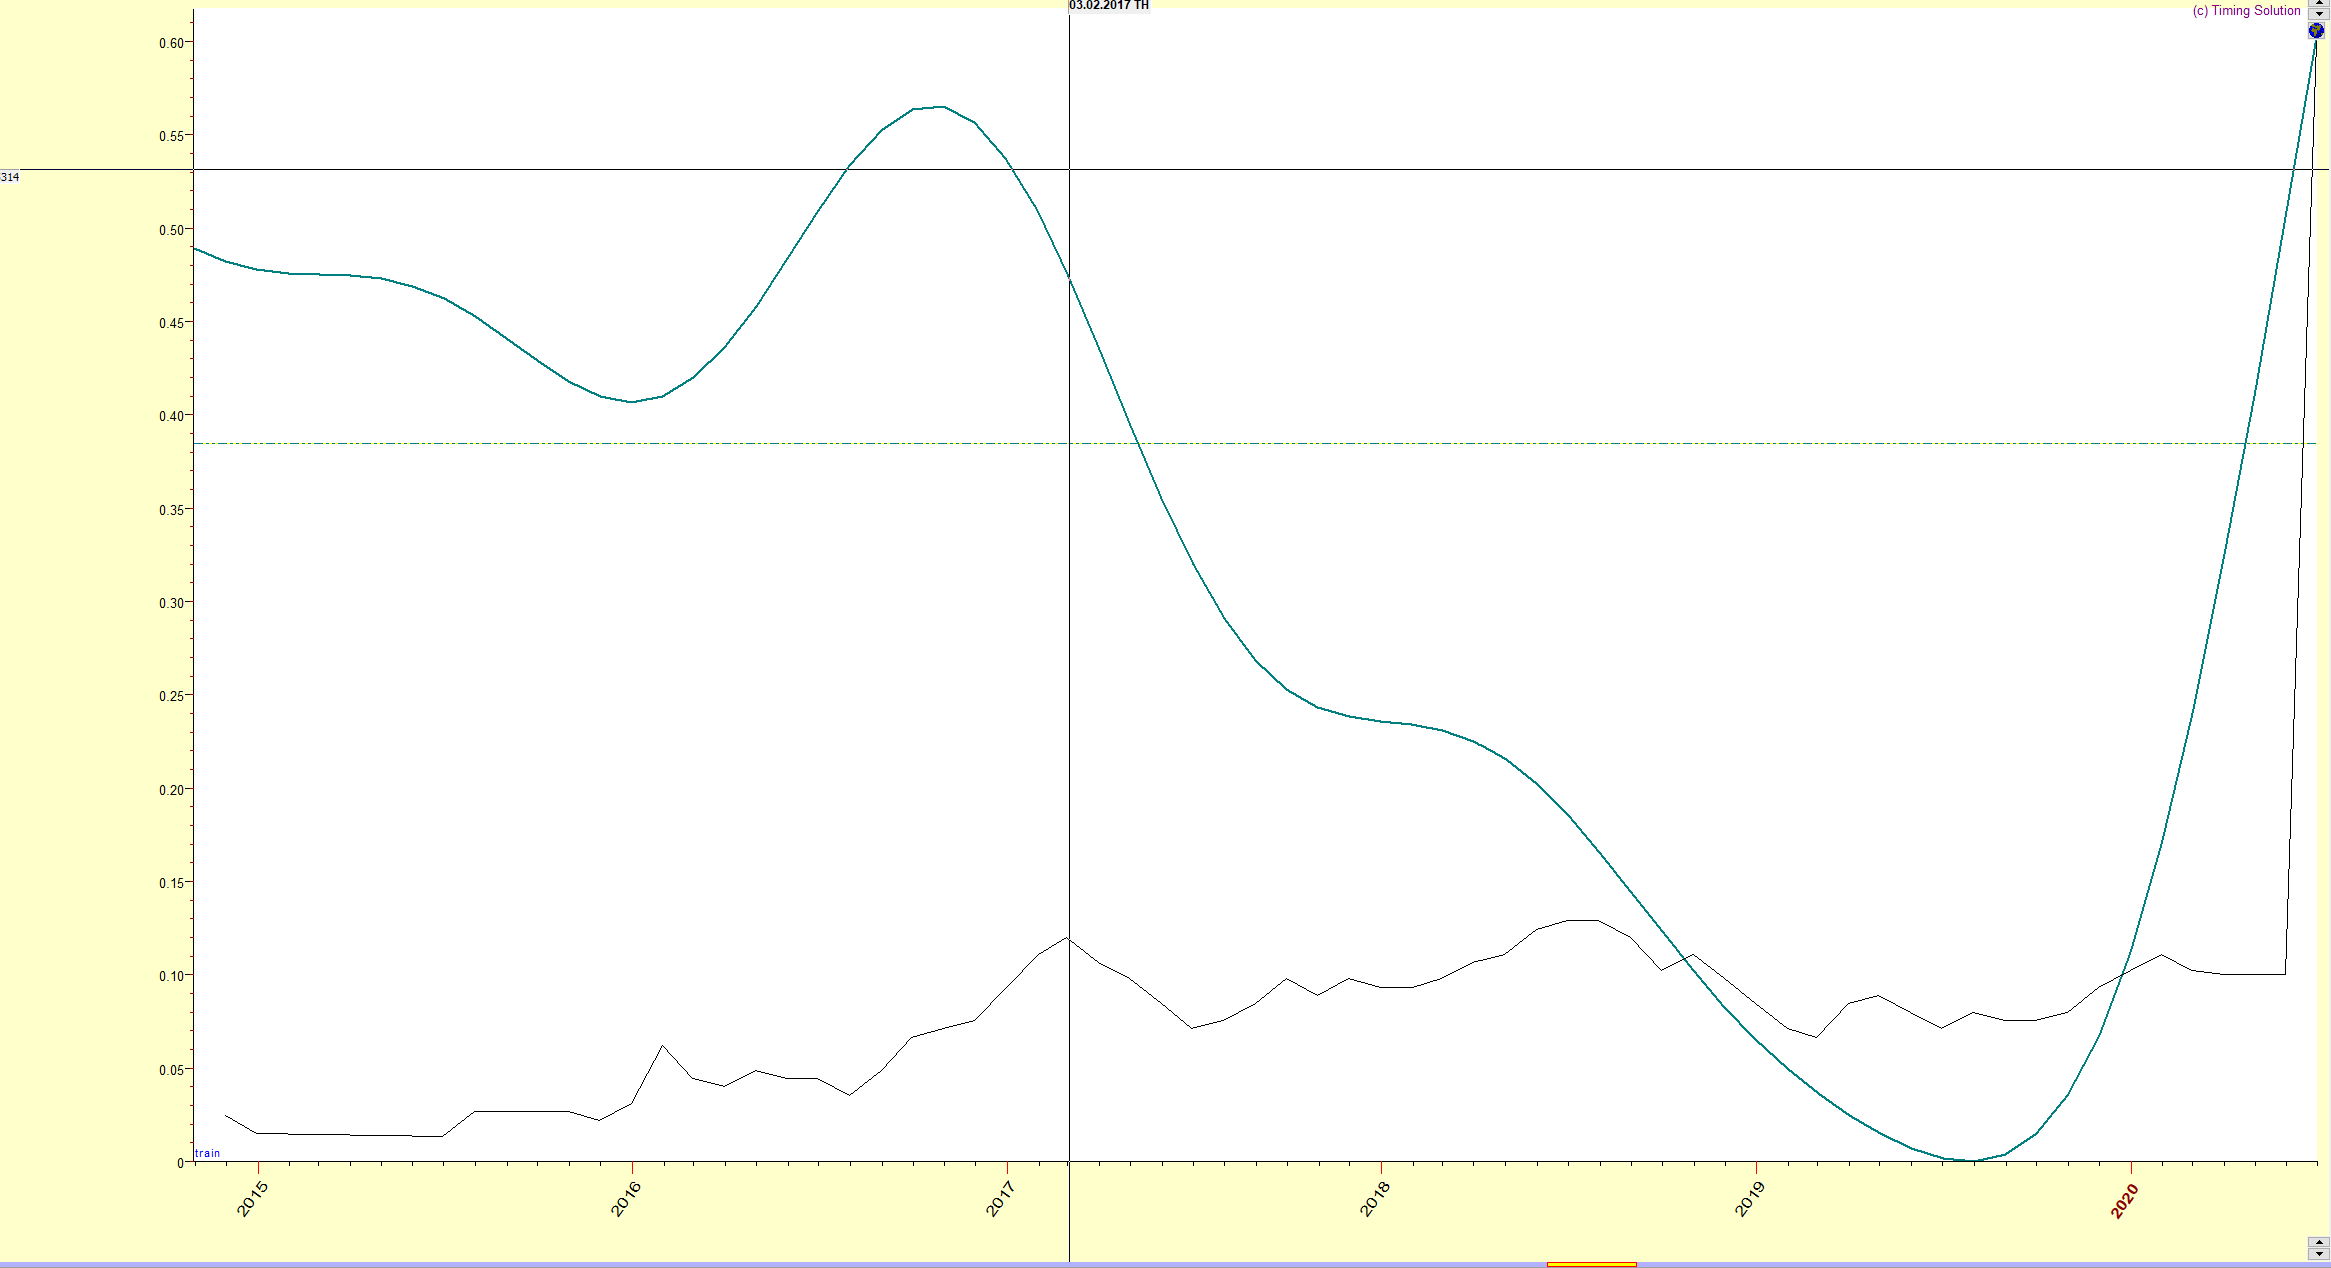
The projection line got the swings right here. And it sure warned of a massive move in inflation starting in late 2019.
Keep in mind that this is yearly data, so there's a lag. But looking at the big picture, this projection line on a yearly cycle has a high correlation with the actual CPI going back more than 100 years.
So let's look at the recent CPI and the corresponding projection line...
|
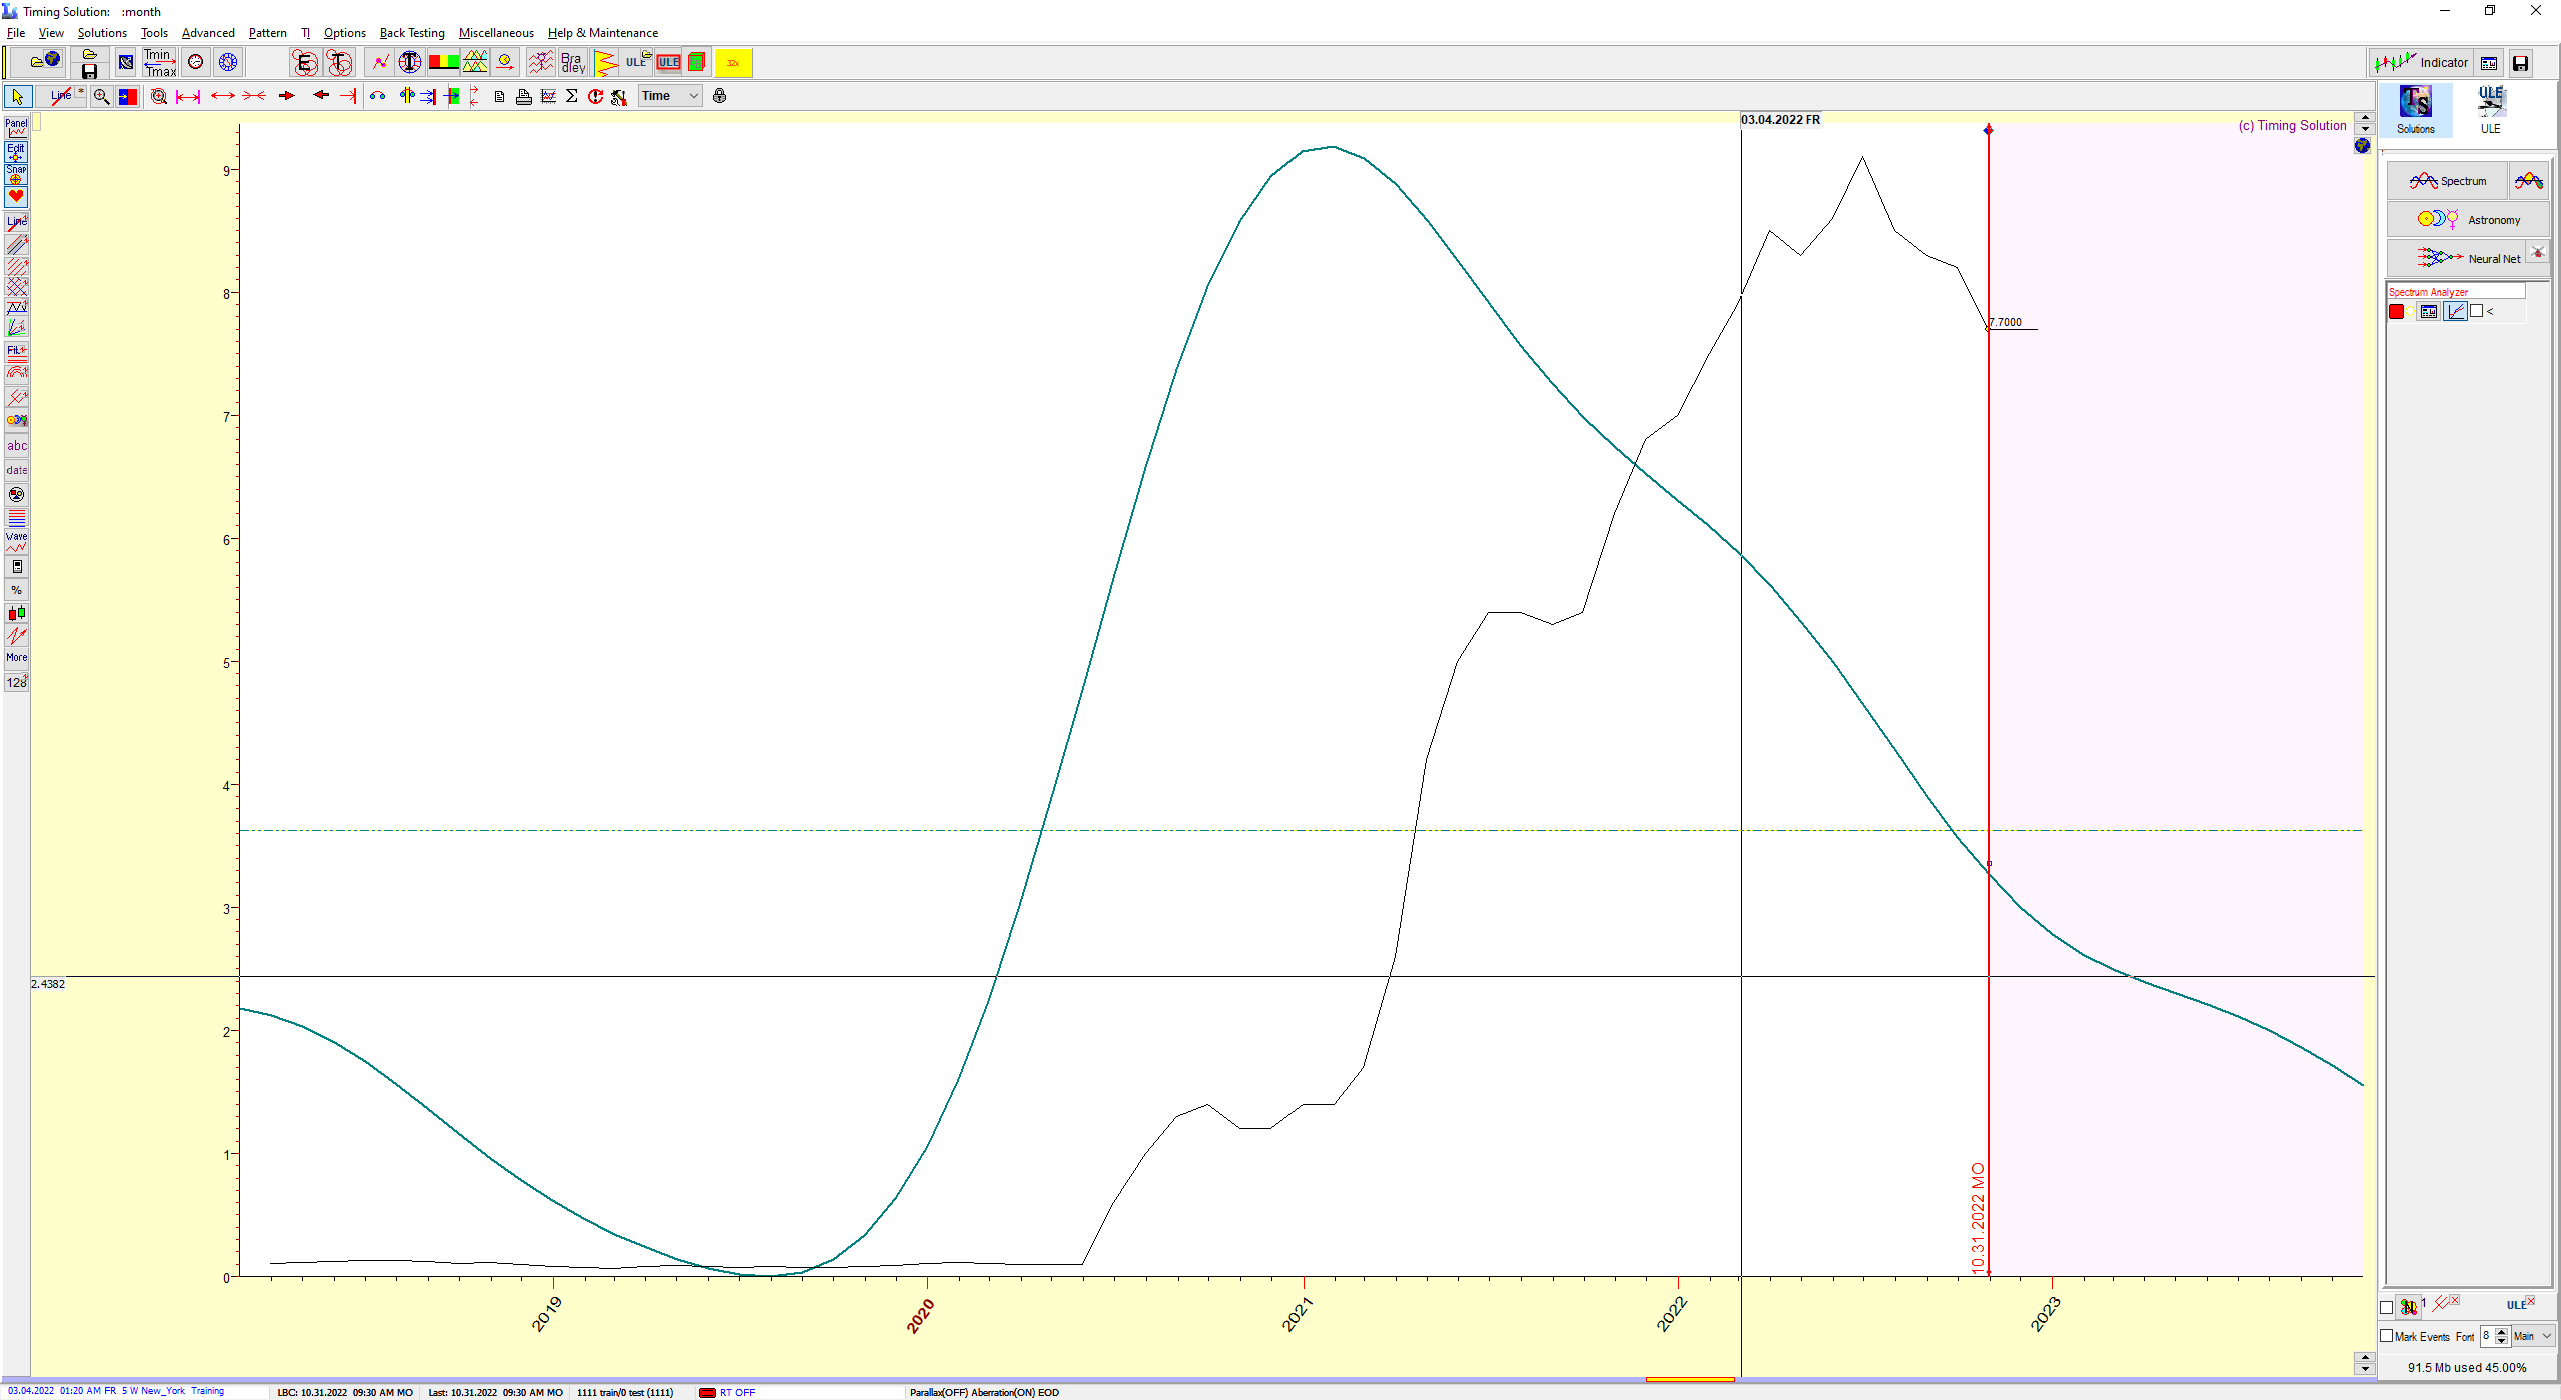
The cycle warned of a rise in inflation, and now look what it's doing... On the right, it's tapering off, indicating that inflation will subside in the big picture.
Will there be periods of higher inflation numbers? I'm sure that will happen. Remember, this is a yearly cycle... The month-to-month data will be volatile. But generally speaking, we can expect inflation to start declining.
And we've seen that already.
So let's look at what the projection line is showing a few years out...
|
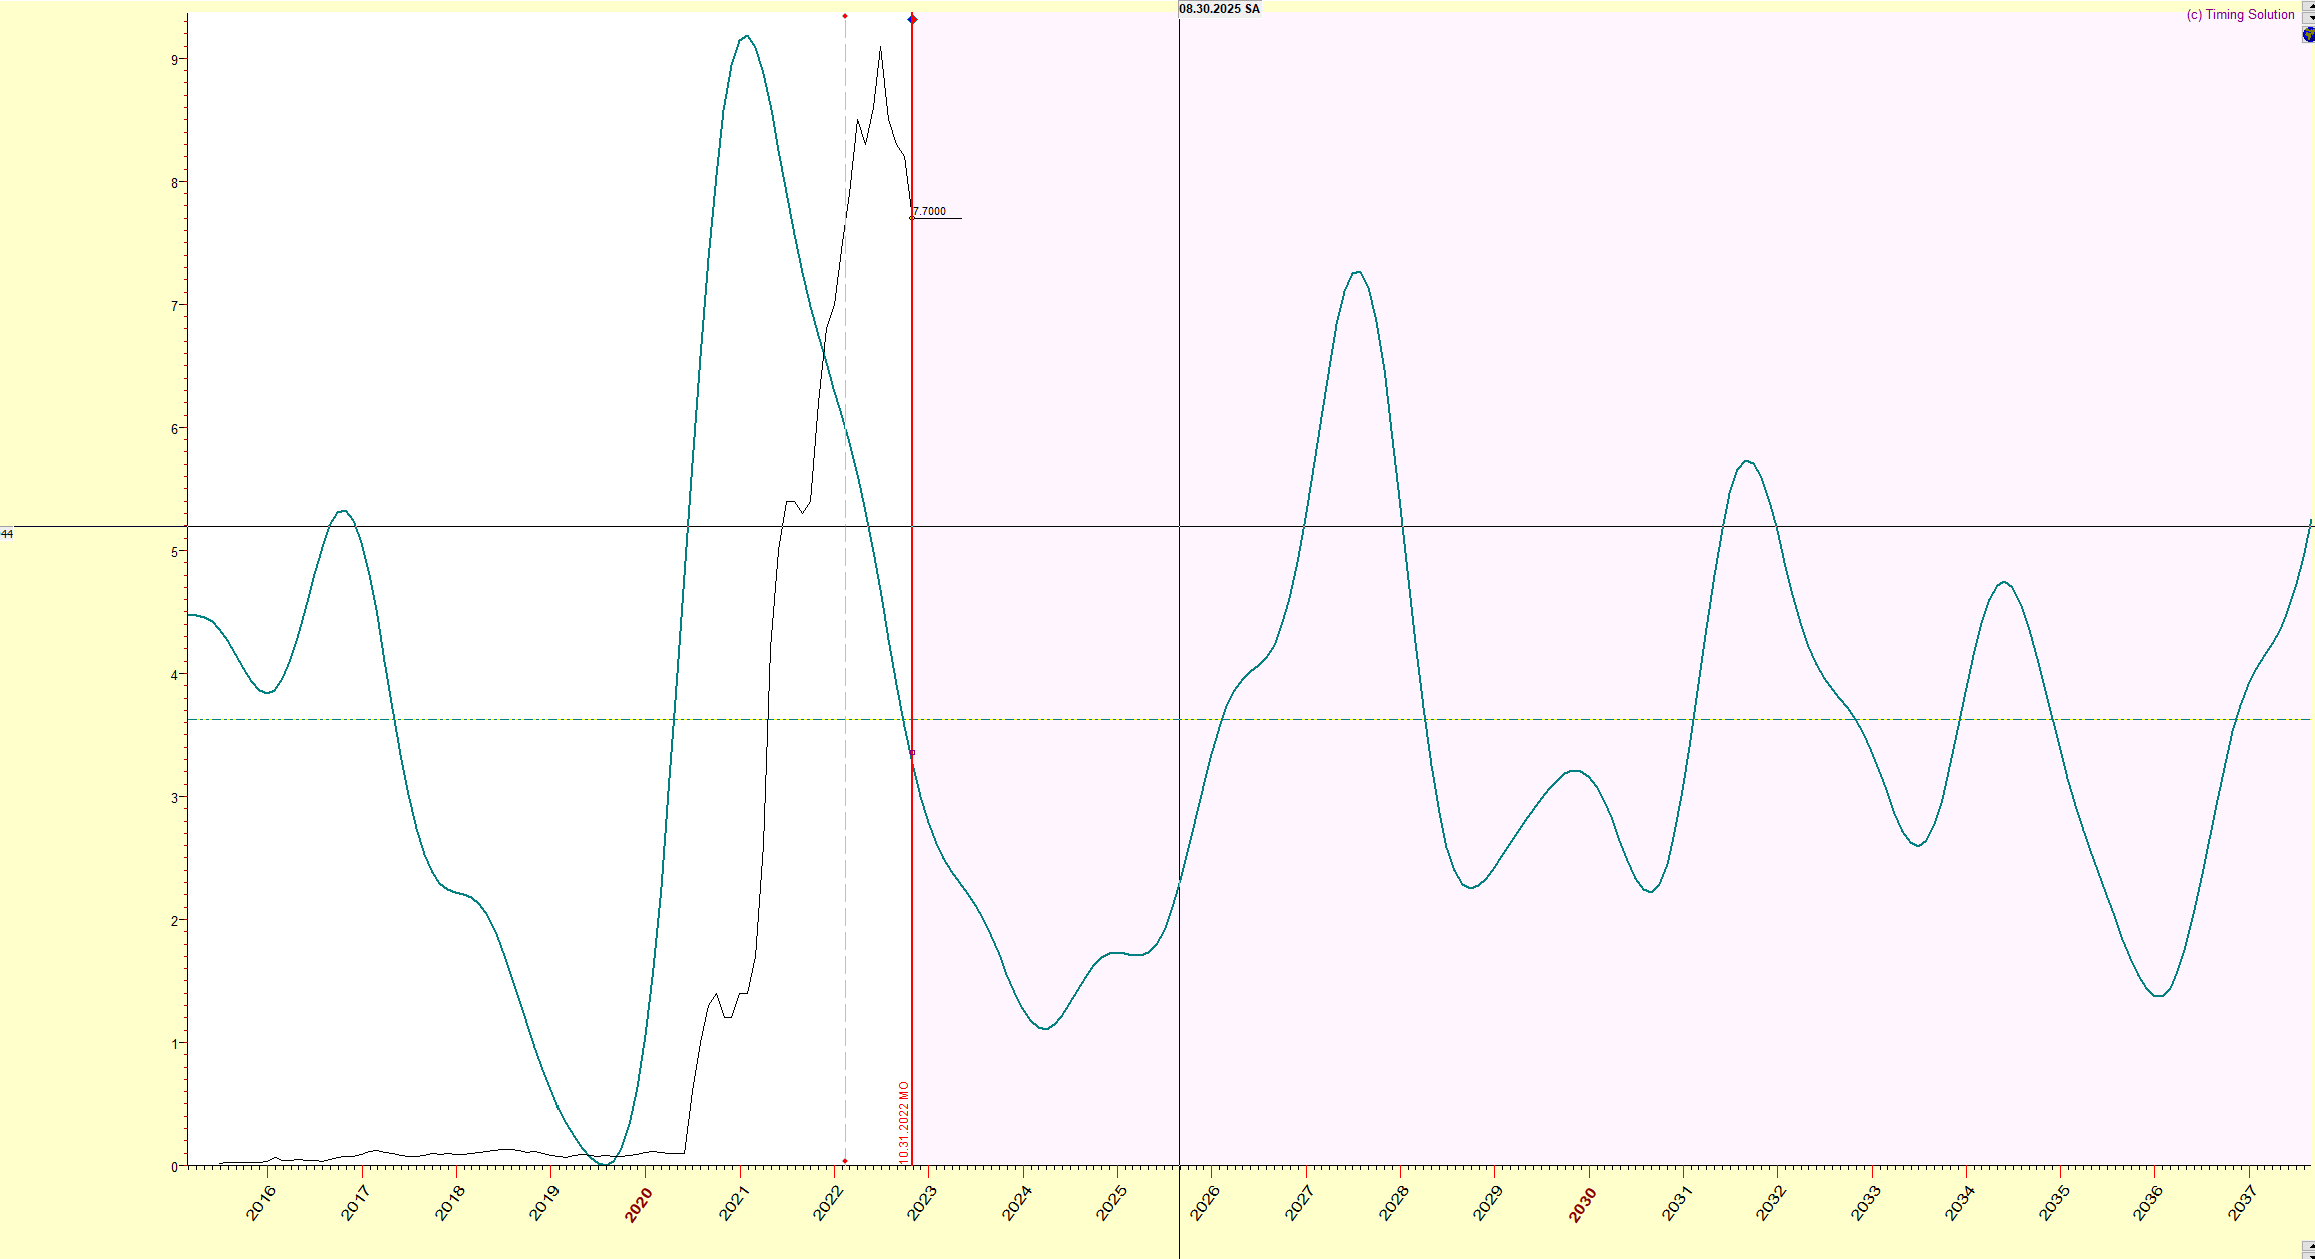
Now look at that! This chart shows a big decline in inflation over the next year or two based on this projection.
![]() So, will Fed Chairman Jerome Powell beat inflation?
So, will Fed Chairman Jerome Powell beat inflation?
Based on the cycles, it looks like he will. But here's something to think about...
If we removed the Fed from the equation, the long-term CPI cycle tells us that inflation will come down regardless.
How will this play out in the stock market, though? What about bonds?
Well, for starters, I wouldn't be short bonds over the next 12 to 24 months, that's for sure.
![]() To sum things up...
To sum things up...
Will the Fed achieve complete victory? I don't know what that means exactly... But based on the cycles and price action, I'll be trading for lower inflation, a possible Fed policy error, and price divergence in the stock market on a massive scale.
I'll be paying more attention to cycles than Fed opinions going forward.
And based on the cycles, we're nearing a monumental inflection point in the next few months. This means we'll have a lot of opportunities to make money in 2023.


Comments
Post a Comment