Investing History
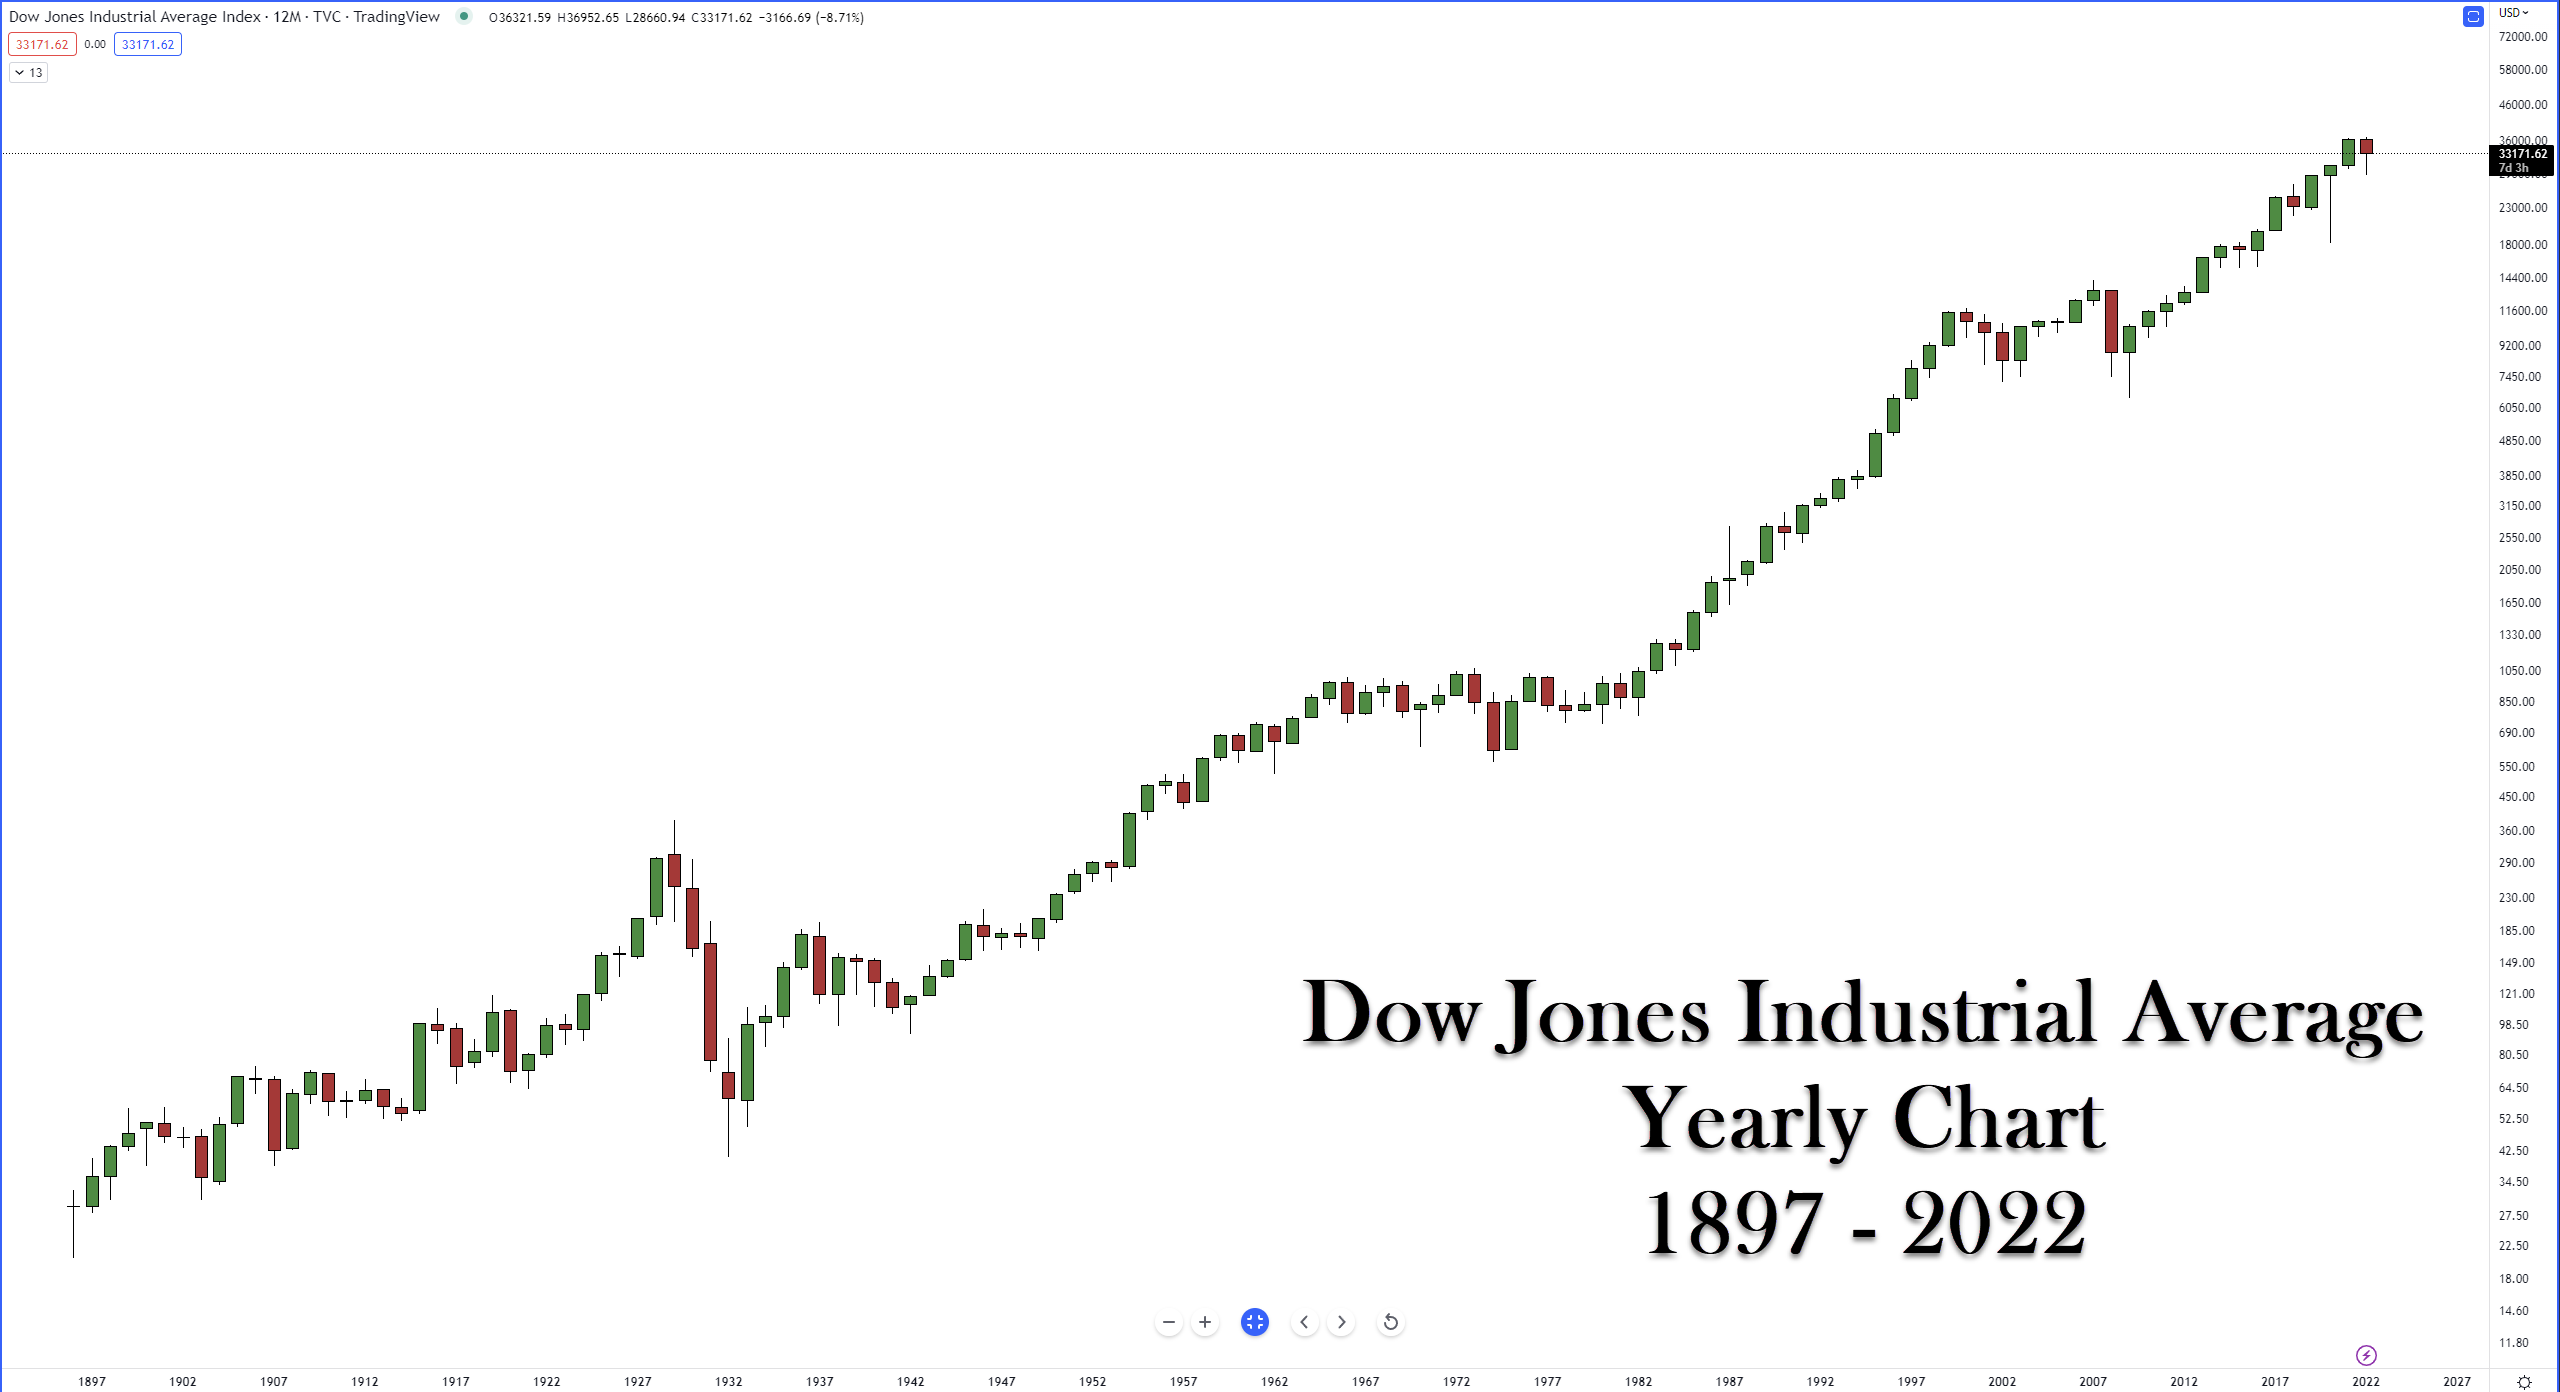
People want to know: what happens to the stock market after it’s had a red/down/loser year? Let’s take a good look at the 1-year DOW chart.
Recent Down Years
Since 2001, the DOW, and S&P 500 have had six losing years: 2001, 2002, 2008, 2015, 2018, 2022
The Nasdaq has had five, the same as the S&P and the DOW, except for 2015.
Only once, since 2021, has one losing year been followed up by another (2001 to 2002).
Looking at the DOW’s historical chart, over the last 126 years, since 1896, 42 of those years have been down – that’s 33.33%. 🧐
Longest Losing Streaks
In the last 126 years, the record for the longest consecutive run of losing years is four.
- 1929 through 1932.
There have been only three instances of the DOW experiencing a 3-year losing streak.
- 1901 – 1903
- 1939 – 1941
- 2000 – 2002
Only four instances of the DOW experiencing a 2-year losing streak.
- 1906 – 1907
- 1916 – 1917
- 1973 – 1974
- 1977 – 1978
Out of the 42 down years:
- a two-year losing streak occurred 9.52% of the time,
- a three-year losing streak 7.14% of the time,
- and a four-year losing streak 2.38% of the time.
20 out of the 42 losing years were part of a losing streak of 2+ years; 47.62% of all the down years. 😳
25-year Block Performance
- 1901 – 1925: 12 losing years (three 2-year losing streaks, one 3-year losing streak)
- 1926 – 1950: 11 losing ears (one 4-year losing streak, one 3-year losing streak)
- 1951 – 1975: 8 losing years (one 2-year losing streak)
- 1976 – 2000: 6 losing years (one 2-year losing streak)
- 2001 – 2025: 5 losing years (one 3-year streak). 🕵️♂️
50-year Block Performance
- 1901 – 1950: 23 down years or 54.76% of the total 42 losing years of the past 126 years.
- 1951 – 2000: 14 down years or 33.33% of the total 42 losing years of the past 126 years.
- 2001 – 2050: 5 down years account for, thus far, 11.90% of the total 42 losing years of the past 126 years. 🤔
Putting It All Together
Does this information tell us anything? Does it tell you anything? That’s for every person to decide on their own, but here are some closing, objective facts:
- It’s been 90 years since the end of the last 4-year losing streak,
- 20 years since the previous 3-year losing streak,
- and 48 years since the previous 2-year losing streak.
The longest stretch of years from one losing streak to the next was between 1979 and 1999 – 20 years. The current streak is 19 years without a 2+ year losing streak. 😬


Comments
Post a Comment